Google adwords was launched by Google as an online marketing tool which helps small or medium size business to become visible to the people who search for products and services on internet. The ads are displayed at the top and bottom of the search list which is showed in Google when we search for something or on their particular website which is related to the search. The ads consist of a single head line with a small description of what the company does or how it could be helpful.
Now much organization and company are using this tool for online marketing their product and services to the people who didn’t know that the company existed or knew about their products and services. Not only small or medium sized company but big companies who are known to the customer are also using this tool to emphasis on their existence to the customer.
The use of Google adwords is preferred more due to its low cost and its effectiveness as it depends on the keywords that are been included in the clickable ads that appear on the Google search engine list only companies with wrong keywords or write weak, low CTR ads doesn’t get benefited from it.
Google Adwords also provides with some features with this tool which are very helpful and unique, like:
- Adword Express: It is a feature that aim’s at small businesses which reduces the difficulty of managing an ad campaign by managing automatically the keywords and ad placement.
- Placement-targeted advertisements: AdWords control panel can be used, and advertisers can enter keywords, domain names, topics, and demographic targeting preferences and ads are placed by Google on whatever sites they see as relevant in the content network in their reach. Google provides a related site list if domain names are being targeted. Bids are done by advertisers on a cost-per-impression (CPI) or cost-per-click (CPC) basis. An ad can take the entire ad block rather being shared by 2 or 3 ads with the help of placement targeting, which results in higher visibility.
- Remarketing: It is a feature that enables the ad to be shown to the people who have visited your site or have clicked the ad once. You have to just add a remarketing tag on your webpage and a list is automatically generated whenever a person visits your webpage and the list can be used afterward to target the viewers who have already shown interest in the company product or services.
- AdWords distribution: With adwords the ad are shown on www.google.com but with adwords distribution Google has given the advertisers an option to enable the ads to be shown on their partner sites also like AOL search, Ask.com, and Netscape. This enables more market reach for the advertisers and effectiveness of the ad campaign.
- AdWords account management: It is difficult for the advertiser to build and manage the ad campaign itself so with Adwords account management the search engine management agencies and consultants offers account management as a new business opportunity.
With Google adwords tracking of the users also can be done i.e. when the user clicks on the advertisement and is transferred to the company site or the desired site then it is possible to track whether he actually bought anything or not. So this way we can estimate the total profit we get from the Google adwords and analyze whether the results are up to our expectations.
Google adwords with its vast features and endless possibility to help a business or company to grow and enhance their market reach has helped many companies in online promoting their product and services but as the features for this get updated and new features are constantly being added to Google adwords it has become more complex for the Advertisers to keep a track of the data and the account for Google adword. The requirement of the era is a more quick and visual representation of their data.
And It is also important for a company to analyze the result of an ad campaign, whether it is fruitful or the campaign is going in vain, for that the decision makers and analyzers need all the data, updated daily and in handy. It becomes more useful when the data is available with just clicks of buttons and that too with the representation of graphs, pie charts and other visual tools that help the analyzers more as their work becomes easy and the data is more presentable.
For this purposes Klipfolio Dashboard can be used, Klipfolio Dashboard is an online dashboard platform for building real-time business dashboards. It allows business users to connect to many data services, automate data retrieval, and then manipulate and visualize the data. Klipfolio uses a schema-less architecture that allows non-technical end users to more easily connect to data sources, and separates data from presentation to more efficiently use and reuse Data Sources throughout the platform.
And also Klipfolio helps in maintaining the data and then representing it in a more visual and user friendly way. In simple terms klipfolio extracts all the data from the source and then creates a dashboard where it is represented or illustrated in more visual ways i.e. with the help of charts, pie charts, graphs and many more.
AdWords does not use a simple REST API, therefore is more complex to integrate into the Dashboard. But dealing with the complexity is what we do at Astrea It Services; we have successfully integrated the data and have created the Data Source and charts for the following queries:
- Daily Cost/conv. (1-per-click) – Last 30 Days
- Monthly cost/conv. (1-per-click) – Last 12 Months
- Daily Conv. (1-per-click) - Last 30 Days
- Monthly Conv. (1-per-click) – Last 12 Months
- Keyword report for “business plan” – last 30 days, includes:
- Quality Score
- Clicks
- Average CPC(cost per click)
Some of the klips are shown that have been integrated by us:
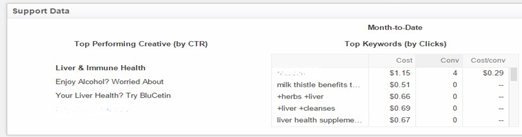
- This shows the searched keywords, then there cost per click, their conversion rate and the average cost per conversion.
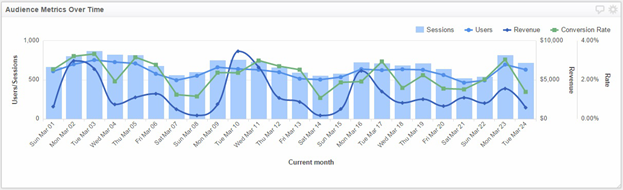
- This klip shows the audience metrics over time on a daily basis i.e. it shows how many users clicked on the ad and then how many users actually bought something which is knows as conversion rate and the graph also shows the daily revenue that is generated by the clicks on the Google Ad.
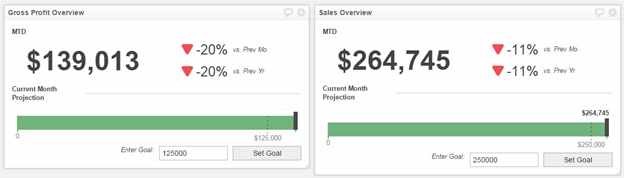
- This klip shows the gross profit overview i.e. the total sales that had been through the clickable ad subtracting the cost per click rate of the ad and the sales overview for a month i.e. the total sales that had been through the clickable ad. A comparison is also shown with the past month data and the past year data.
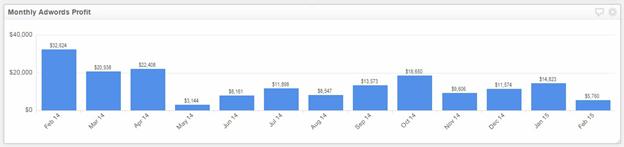
- This klip shows the monthly adwords profit i.e. the total sales from the Google ad subtracting the cost incurred in the Google ad.
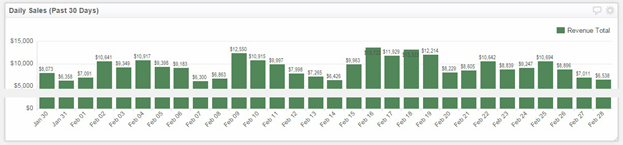
- This klip shows the daily sales from the Google ads data for past 30 days
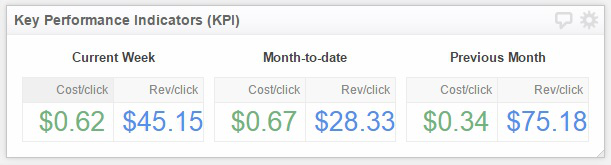
- This shows the key performance indicator i.e. the cost-per-click rate of Google ad words and the average revenue generated per click.
These are some of the example of the work that we have done,at Astrea It Services we have a team of developers who have been specially trained for klipfolio Dashboard integration and have gained a lot of experience by successfully integrating dashboards in klipfolio for many API’s.
We have integrated the data which is representing using more visual aids like:
- Pie charts
- Bar chats
- Graphs
- Metrics
- Maps
- Funnels
- Drill down charts
Additional details on using Google Adwords are available at Klipfolio website.