Facebook being one of the top social media platforms and used for connecting people worldwide has also emerged as a new tool for marketing and promotional activity due to its popularity worldwide. More and more users are getting connected daily through Facebook. So companies have considered it as a new platform for connecting to their customers/users and for measuring their market reach and popularity.
A company’s page on Facebook or running an advertisement campaign on Facebook nowadays is considered essential for marketing and for understanding their market reach. But accumulating all the data about the numbers of followers, daily new followers, daily post, daily likes share and studying the outcome of campaign, and representing all of the data in an easy and unique way is difficult and can turn out to be time taking and expensive task.
Klipfolio is a tool which can help in this task with ease and not with excess cost. Klipfolio offers a scalable solution that makes sophisticated BI accessible to any organization without a large investment in training or services, enabling both technical and non-technical users to make better decisions for their organizations.
For organizations that need to provide embeddable, interactive data analytics, dashboards, and reporting to their employees or customers, Klipfolio delivers Business Intelligence easier, faster and less expensively than ever before.
Facebook provides with business manager so that all the different tools like pages, profile, advertisement campaign or groups can be managed on a single platform. It helps to recover the cost or investment by the response from the viewers with the help of APIs.
Klipfolio integrates the Facebook data and depicts it in more readable, presentable and user friendly way and can be customized according to the user requirement and thus helping the companies to use the data in their presentations or companies profile to attract more and more customers and investors.
Astrea It Services has integrated Facebook data for many companies and has developed expertise in this area and have developers which are specialized in Klipfolio integration.
Facebook advertisement campaign have been integrated to represent the latest result of the campaign or to see the whether the campaign was a success or not.
It can be integrated with the result showing the klips like
Likes:
The number of likes a post or the pages get it can be shown on a daily basis record or on the total number likes.
Share:
The number of share a post or the pages get it can be shown on a daily basis record or the total number.
Comment:
The detail of comment on a post is shown
Home feed:
All the data on the page or profile is shown
News feed:
All the data that is shown in news feed is displayed
The screenshot displays sample data from Facebook in a Klip.
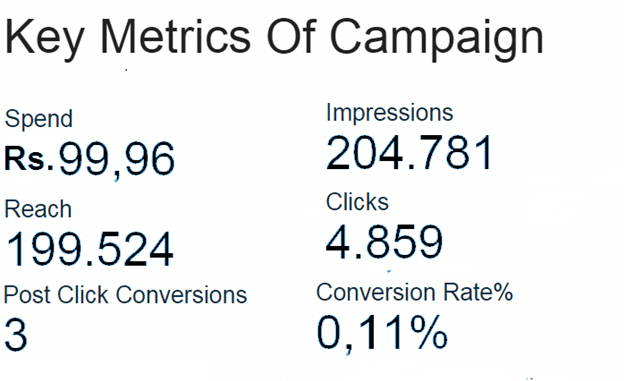
Total cost:
It shows the total cost incurred in the advertisement campaign till date
Click through rate (CTR) :
Click-through rate (CTR) is a way of measuring the success of an online advertising campaign for advertisement campaign by the number of users that clicked on a specific link
Impressions:
An impression is a measure of the number of times an ad is seen. Clicking or not is not taken into account. Each time an ad displays it is counted as one impression.
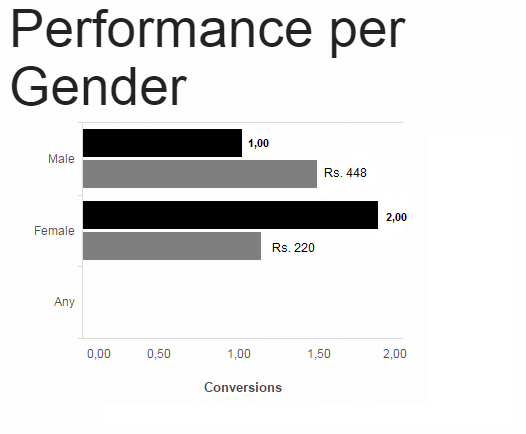
Gender view:
All the data for the campaign is segregated in gender format i.e. between male and female the total number of conversions and the cost incurred in it.
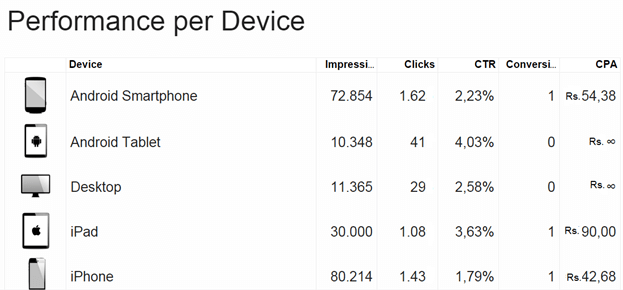
Device view:
All the data for the campaign is segregated in device format i.e. between different device available devices in market and can be used to access the advertisement, the total number of conversions and the cost incurred in it.
Overtime performance:
The performance of the campaign from the start of the campaign to till date i.e. the cost incurred, no of conversion, total clicks on the link.
Daily performance:
the present day performance of the campaign.
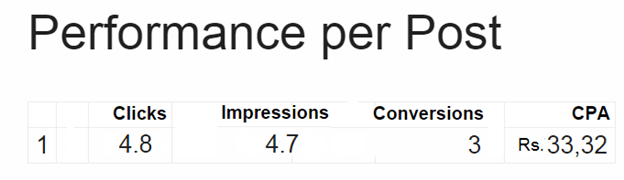
Post performance:
Post performance i.e. views on post, click on link, like share on the post.
Conversions:
The number of viewers of the advertisement who are converted to paying customers
Cost incurred in any campaign is high and it is important to get the desired result for the amount of investment made. This integration helps companies to see the result in just one click and see whether they are getting the result or not. The integration shows every aspect of the campaign that the company should know or require for comparison, decision making or for designing the action plan.
We have integrated the data which is representing using more visual aids like:
- Pie charts
- Bar chats
- Graphs
- Metrics
- Maps
- Funnels
- Drill down charts