Klipfolio has now become an essential tool for analytics, with its feature to give visually aid to the integrated data from any site, analyzing the data has become more convenient. Klipfolio keeps on updating the platform to give more ease and more usefulness to its customers. Klipfolio gallery is one of the revolutionary steps toward making the Klipfolio easier, less time consuming and more productive. With Klipfolio gallery now the dashboards can be created with just few clicks of the buttons.
Klipfolio gallery has bridged the gap between an individual who do not have any experience in coding, and the Klipfolio dashboard creation. Previously also creating Klips in the Klipfolio dashboard was easy but required a little knowledge of the coding so a non-technical gay was unable to use the Klipfolio by himself; he needed to hire a technical gay to do that job. But that has changed now; simple and more used Klips can be created with just clicks of the buttons.
A company mostly requires data for their Facebook page, LinkedIn, Twitter, Google AdWords and most importantly for the Google Analytics or Salesforce. As through this the markets reach, prospects, customers, sales, revenue and many things that a company requires for determining its strategies.
Now with Klipfolio’s new feature that is Klipfolio gallery, any one with the right credentials to the desired accounts can create a Klip in just a matter of seconds. Klipfolio gallery is a list of predefined metrics for the popular cloud based site and data storage. Now instead of starting from scratch everyone have an upper hand in the creation of the Klips.
Timely view of the performance metrics is important for the company, and then if one has to wait for a IT employee to integrate the data. Klipfolio gallery provides us with ease of creation and ease of use, so that we do not focus on creating the dashboard but on analyzing the data. Klipfolio helps in saving time and saves the resources as well, as now for integration of data in Klipfolio more resources are not required.
For creating a Klip all one has to do is:
-
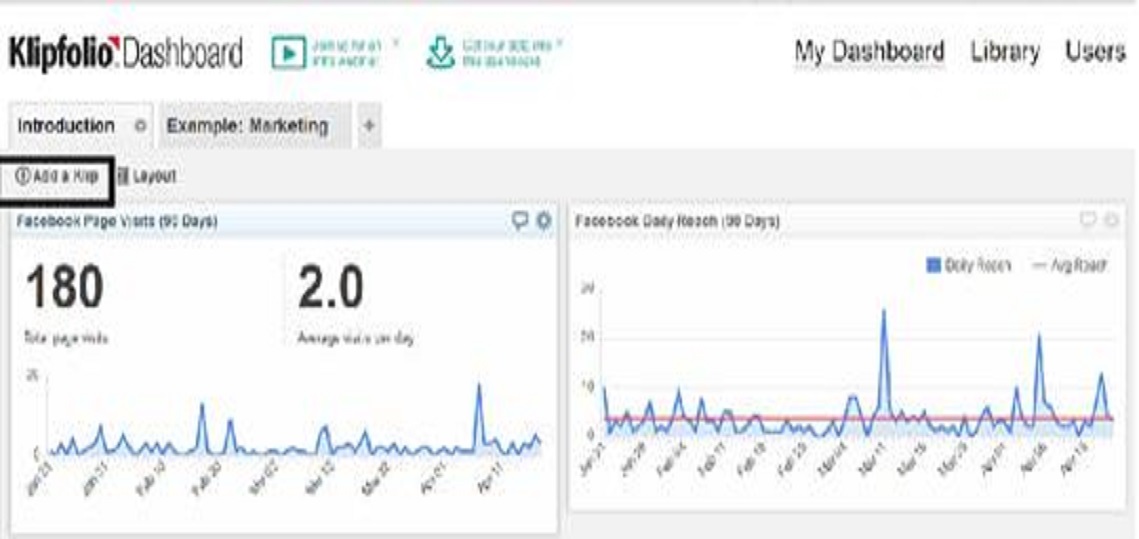
Login to Klipfolio and then click on “Add a Klip” on the upper left hand side of the screen.
-
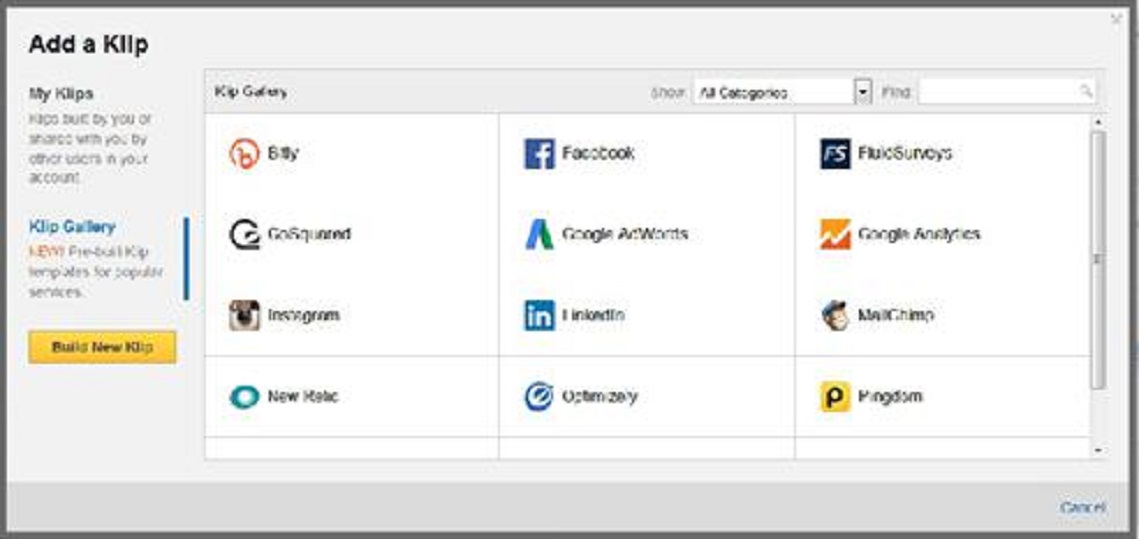
A list of predefined Klips is shown and select the desired measure for which Klip has to be created.
-
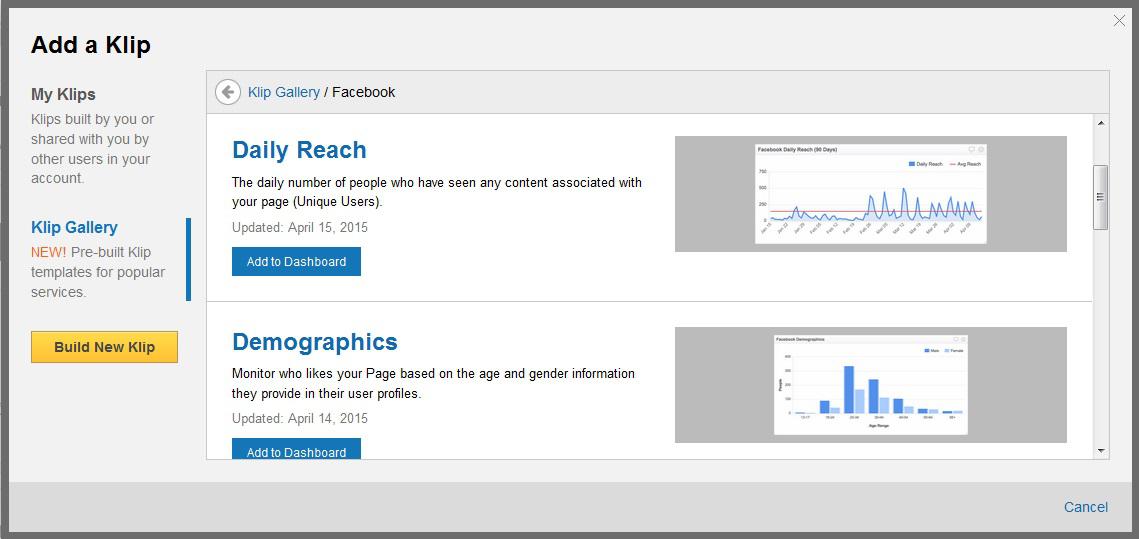
A list of pre defined metrics appears as we select a measure. For example we have selected Facebook.
-
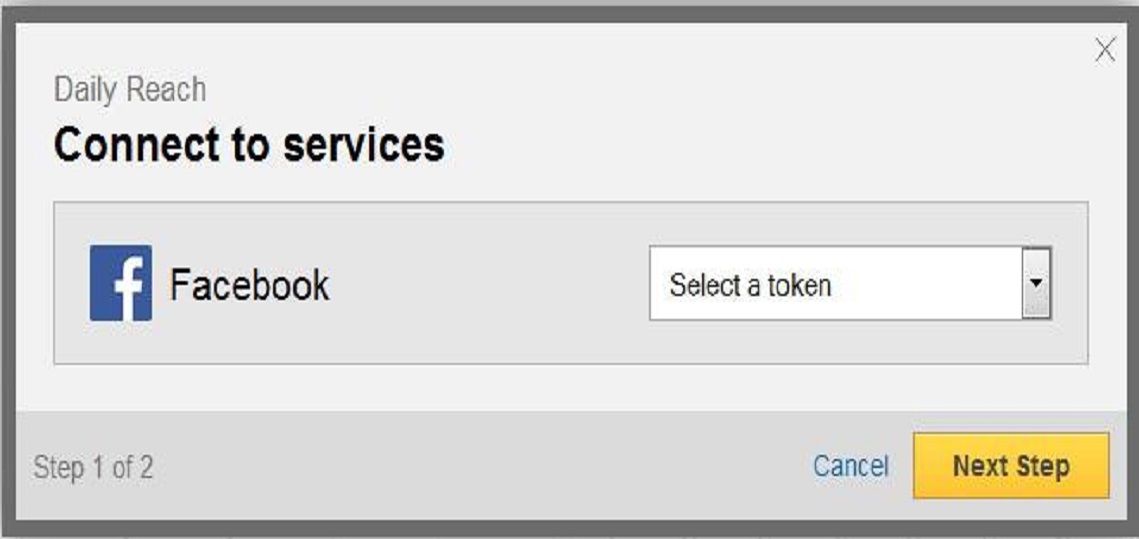
Then click on the “Add to Dashboard” button and a dialogue box appears to connect to the services, as here we have selected Facebook. The token for the services is selected and then we navigate to the next step.
-
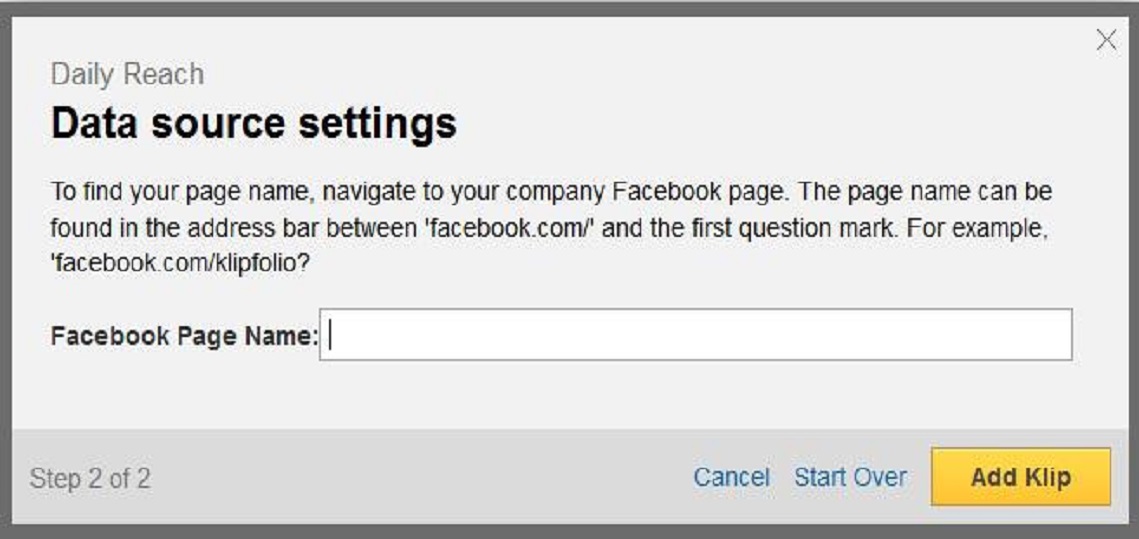
Then data source settings are done where we just have to add the page name which Is listed between the / and first question mark in the address bar.
-
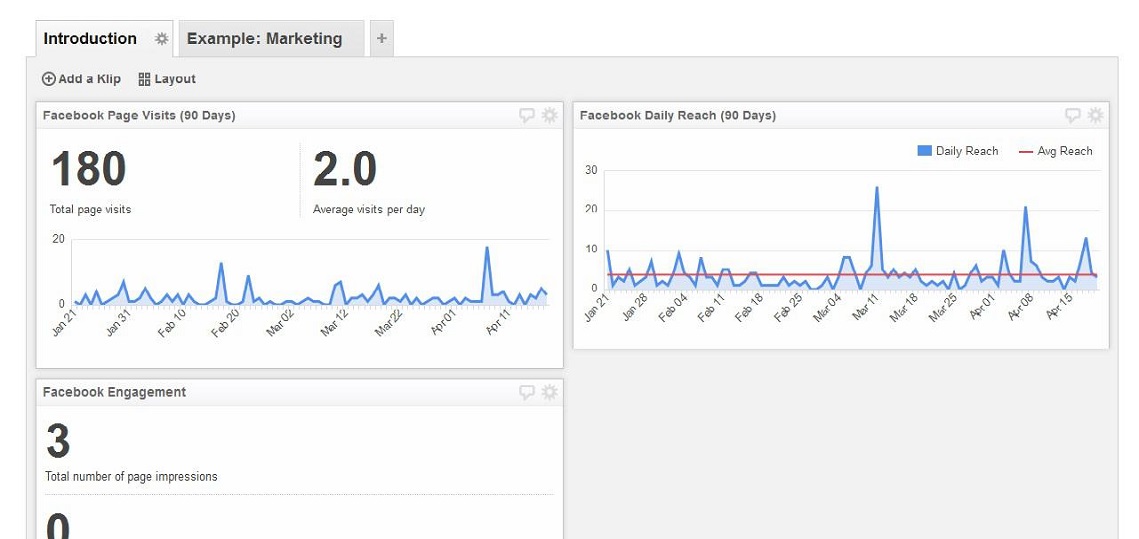
These are some of the Klips that are created using the Klipfolio gallery, many such Klips can be generated through Klipfolio gallery feature in just few clicks of the buttons.
The feature is not limited to this, once the Klip is created it is fully editable and the calculations can be changed as the person desires. There is also an option to add new data sources, so one is not limited to the listed data sources.
More than 75 Klips are available now and new Klips will on upgrading. These include Klips for data from social networks like Facebook, LinkedIn, Twitter, Instagram; newsletter platforms like Mailchimp; help desk software like userVoice; Google marketing tools like Google Analytics and AdWords; and other applications like Salesforce, Optimizely, Bitly, FluidSurveys, New Relic, and Pingdom..
Have any questions? Feel free to drop an email to support@astreait.com or visit astreait.com to schedule a consultation.