In discrete and process manufacturing, sales operations teams rely heavily on Salesforce Manufacturing Cloud’s Advanced Account Forecasting to project future demand. By synthesizing historical order patterns, sales rep market adjustments, and planned sales agreement commitments, account managers can establish accurate bottom-up demand baselines.
However, classic account-based forecasting operates in a dangerous silo: it measures customer demand without validating operational feasibility. When sales teams forecast a 30% increase in product volume for a key account, the forecasting matrix accepts the entry without checking if the designated production facility or assembly line has the physical throughput to build it. The result? Unrealistic production schedules, supply chain bottlenecks, missed delivery SLAs, and inflated revenue expectations.
In this technical guide, we will walk through how to build a Multi-Site Capacity-Aware Forecasting Engine directly inside Manufacturing Cloud using Custom Capacity Objects, Data Processing Engine (DPE) definitions, and Custom Metrics in Advanced Account Forecast sets.
The Architectural Gap: Demand vs. Capacity Silos
Salesforce Manufacturing Cloud’s Advanced Account Forecasting helps teams forecast product demand, but demand alone does not confirm whether manufacturing plants can fulfill it.
For example, if forecast demand is 12,000 units per month but the plants can produce only 10,000 units, capacity utilization reaches 120%. This is a production constraint that stays invisible unless the two numbers are compared.
In practice, the comparison is rarely one-to-one:
- Multiple products belong to the same product family and draw on the same capacity.
- Multiple accounts order from the same product family in the same month.
- Multiple plants manufacture the same product family, each with its own monthly capacity.
Therefore, capacity validation must be done at the product family and month level. The forecast demand of all accounts and products in a family is added up and compared with the combined capacity of the plants that produce that family in that month. Comparing individual forecast rows with a single capacity figure would miss real overloads.
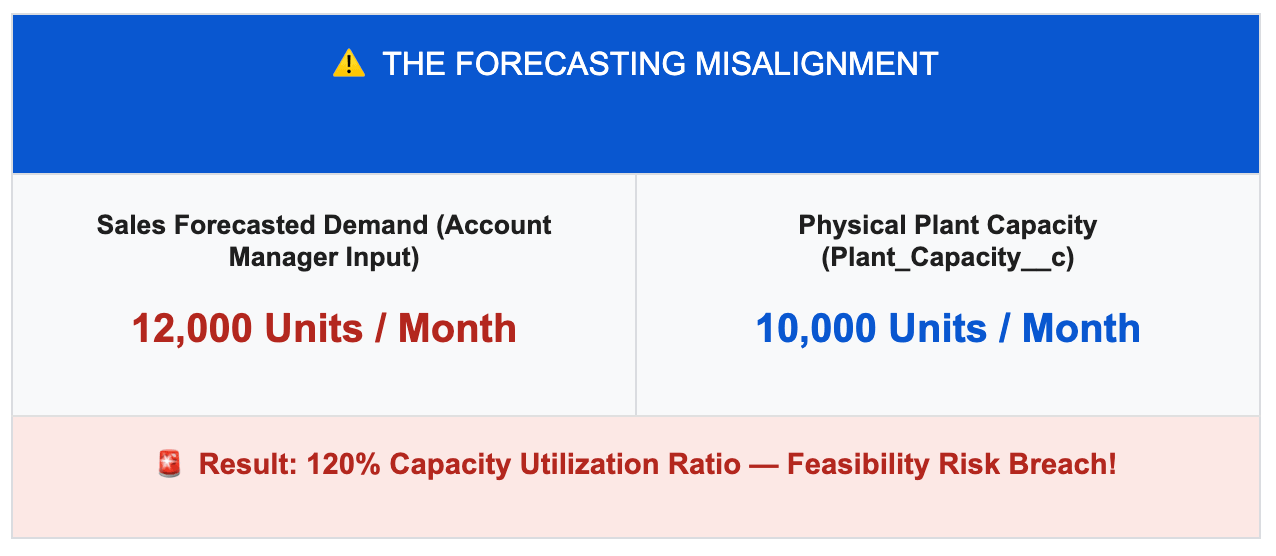
Without capacity-aware forecasting, manufacturers may face:
- Production Planning Issues: Forecasted demand may exceed available plant capacity.
- Inefficient Resource Allocation: Procurement, workforce, and production plans may be based on unrealistic demand.
- Delayed Risk Detection: Sales and operations teams may discover capacity shortages too late to adjust their plans.
Technical Solution Architecture
By extending standard Advanced Account Forecasting with a custom capacity object we calculate a Capacity Utilization Ratio for every product family and month, and show it next to the forecast quantity in the forecasting grid. The calculation runs as a batch job after the forecast is generated or recalculated, so the ratio is as current as the last run.
| 1. Data Inputs: Read three sources: the generated forecast records (account, product, month, forecasted quantity), the product family of each product, and the capacity records (family, monthly limit, start and end dates). |
|
|
| 2. Demand Aggregation: Add up the forecasted quantity of all accounts and products in the same product family for each month. This gives one demand figure per family and month. |
|
|
| 3. Capacity Matching: Join the demand to the capacity records of the same family. Keep only the records whose start and end dates cover that month, and add up the capacity of all plants producing that family. This gives one capacity figure per family and month. |
|
|
| 4. DPE Calculation: Divide the aggregated demand by the combined capacity to get the Capacity Utilization Ratio (as a percentage), and derive a Capacity Status Code (0 = within capacity, 1 = at risk, 2 = critical). |
|
|
| 5. Writeback and Display: Write both values back to every forecast record of that family and month, and add them as forecast measures, so users review utilization alongside forecast quantities in the forecasting grid. |

Core Architecture Components
- Manufacturing Cloud (Advanced Account Forecasting): Generates time-phased forecast records (Advanced Account Forecast Fact) for each account, product, and month, and stores the measure values.
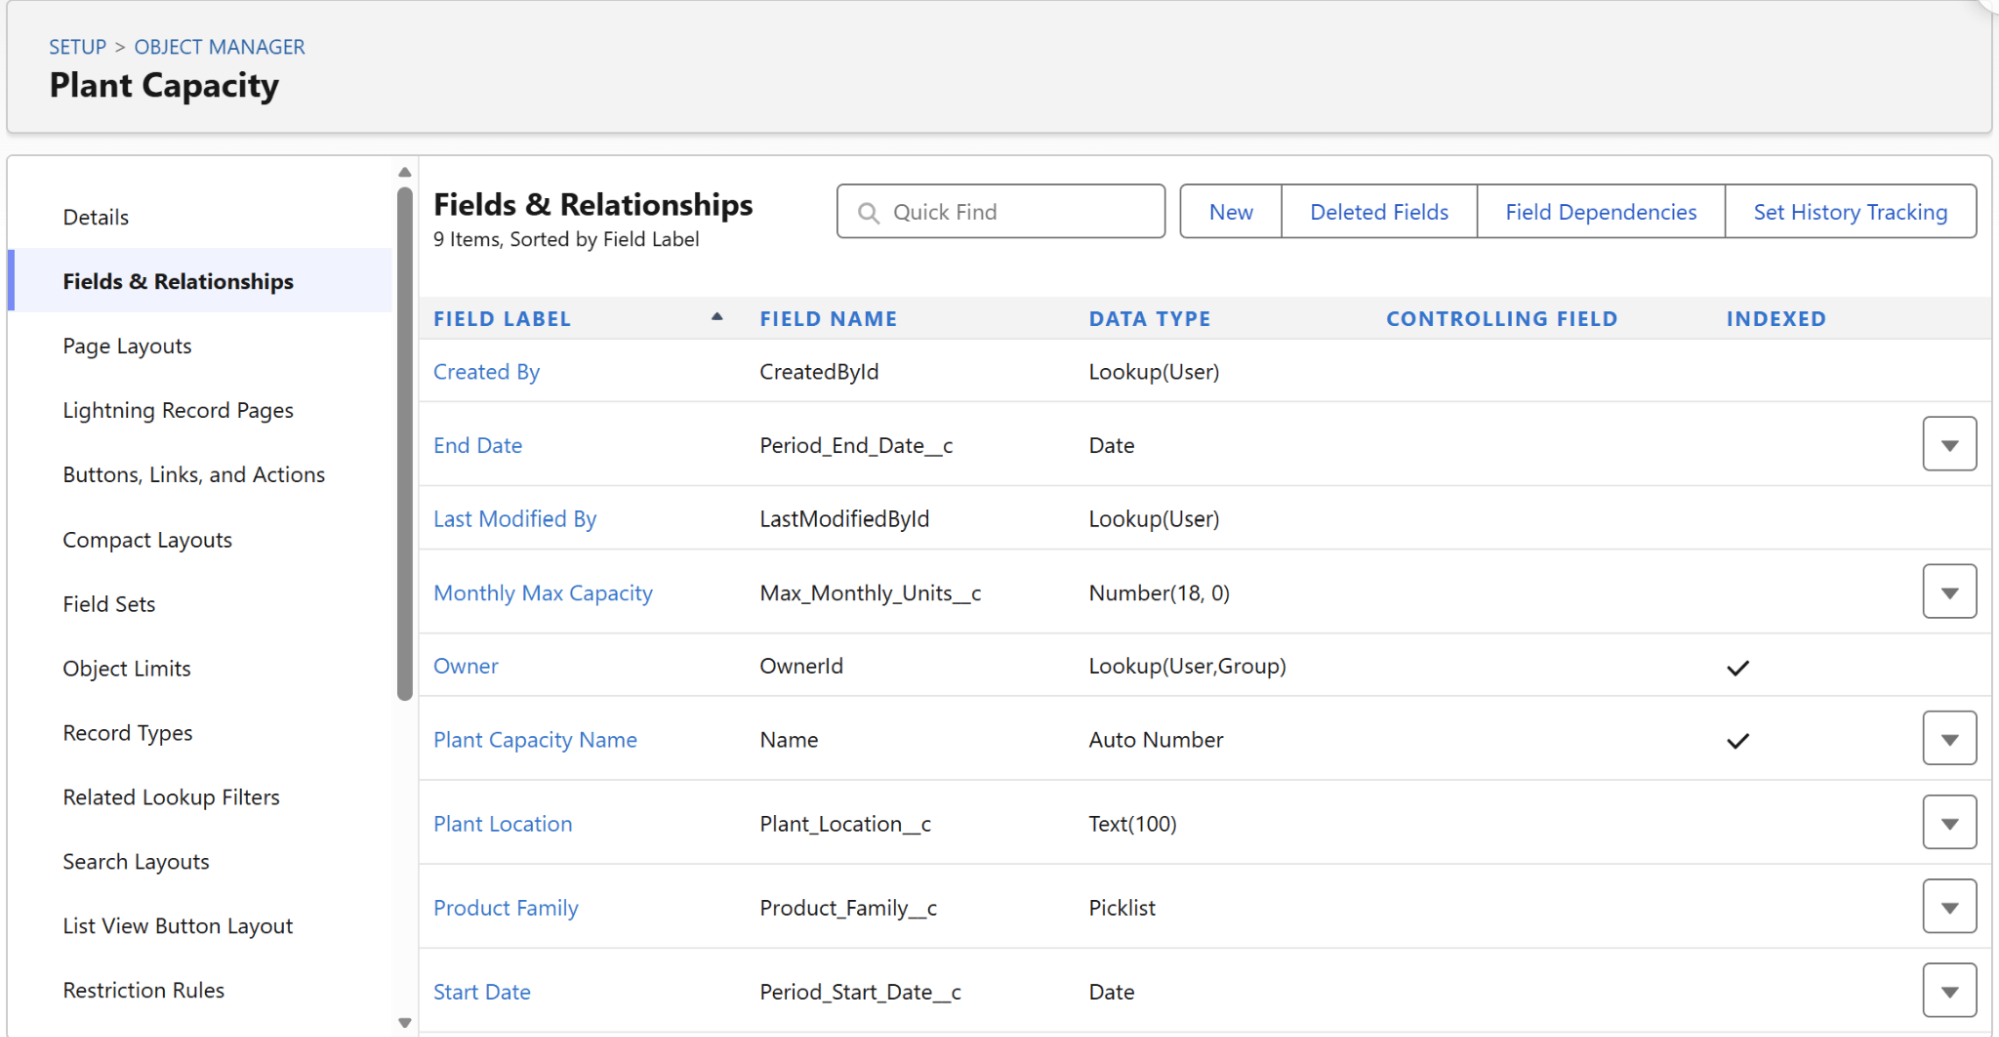
- Plant_Capacity__c (Custom Object): Stores plant throughput limits by location, product family, monthly capacity, and validity dates (start and end).
- Data Processing Engine (DPE): Aggregates forecast demand by product family and month, matches it with the combined capacity of the plants producing that family, and computes the utilization percentage as a batch job.
- Custom Forecast Measures: Display the calculated Capacity Utilization Ratio and Capacity Status Code next to the forecast quantity in the forecasting grid.
Step-by-Step Implementation Guide
Step 1: Define the Plant Capacity Data Model
To establish capacity boundaries, build a lightweight custom object inside Salesforce to store plant throughput limits per product family and time period.
| Field Label | API Name | Data Type | Description |
|---|---|---|---|
| Plant Location | Plant_Location__c | Text (100) | Identifies the physical facility (e.g., Austin Plant 1). |
| Product Family | Product_Family__c | Picklist | Maps directly to Product2.Family (e.g., Hydraulic Engines). |
| Monthly Max Capacity | Max_Monthly_Units__c | Number (18, 0) | Maximum unit output threshold per monthly schedule period. |
| Start Date | Period_Start_Date__c | Date | Beginning date of capacity allocation window. |
| End Date | Period_End_Date__c | Date | End date of capacity allocation window. |
Tip: If your organization uses an external MES (Manufacturing Execution System) or ERP (e.g., SAP, Oracle), this object can be periodically populated via standard Salesforce Bulk API or Data Cloud integrations without requiring complex real-time integration middleware.
Sample capacity records
| Plant Location | Product Family | Monthly Max Capacity | Start Date | End Date |
|---|---|---|---|---|
| Austin Plant 1 | Hydraulic Engines | 7,200 | 01/10/2026 | 31/12/2026 |
| Dallas Plant 2 | Hydraulic Engines | 4,000 | 01/10/2026 | 31/12/2026 |
| Dallas Plant 2 | Heavy Hydraulics | 6,000 | 01/10/2026 | 31/12/2026 |
| Houston Plant 3 | Industrial Pumps | 3,000 | 01/10/2026 | 31/12/2026 |
Hydraulic Engines is produced in two plants, so its combined capacity is 11,200 units per month (7,200 + 4,000).
Data rules
- The Product Family picklist values must match Product2.Family exactly (spelling and capitalization), because the DPE joins on this value.
- Set End Date to the last day of the window. An end date one day too late pulls the next month into the window.
- Capacity is per month. If you receive a quarterly total, divide it by the number of months, or create one record per month if capacity varies.
- Avoid overlapping windows for the same plant and family, or that plant’s capacity is counted twice.
Step 2: Extend the Forecast Set with Custom Measures
Next, add the fields and forecast measures needed to calculate and display capacity usage in the forecasting grid. The calculated values are stored on the forecast records (Advanced Account Forecast Fact), and the forecast set shows them as measures.
Part A: Create the fields on the forecast records
Navigate to Setup > Object Manager > Advanced Account Forecast Fact > Fields & Relationships and create three fields:
- Capacity Utilization Ratio : A Percent field with 16 digits and 2 decimal places. The DPE writes the utilization here (for example, 105 displays as 105%).
- Capacity Status Flag a Text field of length 30. The DPE writes WITHIN_CAPACITY, WARNING_AT_CAPACITY or CRITICAL_OVER_CAPACITY here.
- Capacity Status Code : a Formula field that returns a Number with 0 decimal places, converting the flag to a number the grid can display. Set blank fields to be treated as blanks, and use this formula:
   IF(ISBLANK(Capacity_Status_Flag__c), NULL,
   CASE(Capacity_Status_Flag__c,
        "CRITICAL_OVER_CAPACITY", 2,
        "WARNING_AT_CAPACITY", 1,
        0))
The code works as follows: 0 means within capacity (100% or below), 1 means at risk (above 100% up to 110%), and 2 means critical (above 110%).
Part B: Add the measures to the forecast set
- Go to Setup > Advanced Account Forecasting > Forecast Sets, Deactivate forecast set, and click Edit.
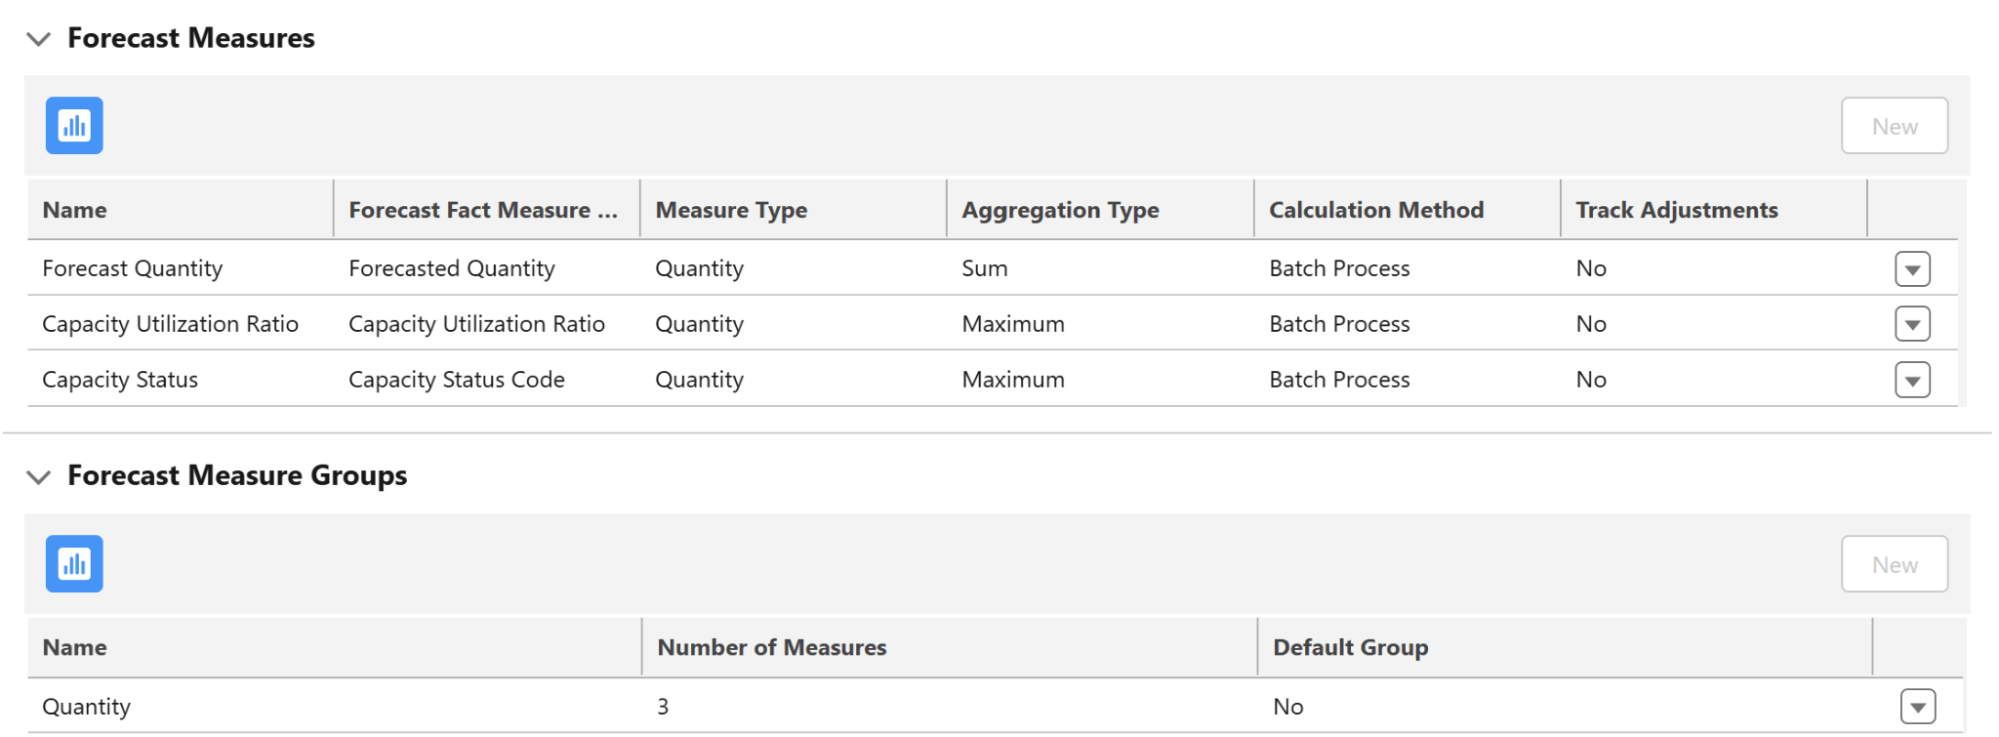
- Under Forecast Measures, New and create a measure named Capacity Utilization Ratio. Select the Capacity Utilization Ratio field, set the measure type to Quantity, the aggregation type to Maximum, and the calculation method to Batch Process.
- Create a second measure named Capacity Status, using the Capacity Status Code field with the same settings.
- Under Forecast Measure Groups, add both measures to the group that holds Forecast Quantity, so they appear in the same grid.
- Activate the forecast set.
Step 3: Customize the Data Processing Engine (DPE) Definition
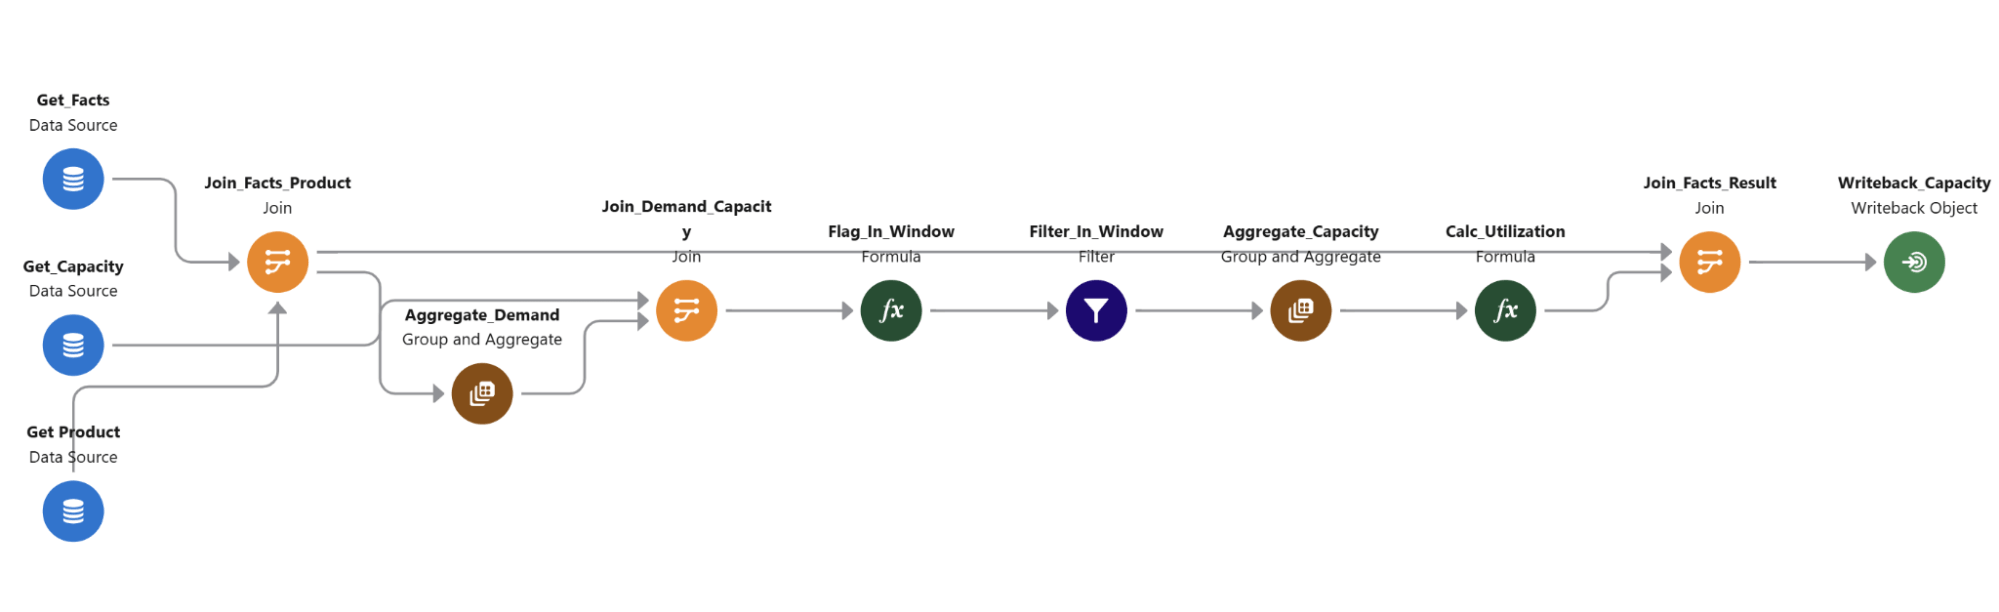
Salesforce Manufacturing Cloud uses the Data Processing Engine (DPE) to calculate, aggregate, and write back forecast numbers. Instead of editing the default forecast definitions, we create a separate definition that reads the generated forecast records, so the base forecast stays untouched. Run it after each Generate, Recalculate, or Rollover.
Go to Setup > Data Processing Engine > New. Name it Capacity Utilization Check, set the process type to Advanced Account Forecast, and choose Batch Processing. Then add the following nodes.
Data sources
- Get_Facts (Data Source): object Advanced Account Forecast Fact, fields Id, Product, Period Start Date, Forecasted Quantity, and Advanced Account Forecast Set Use.
- Get_Product (Data Source): object Product, fields Product ID and Product Family.Get_Capacity (Data Source): object Plant Capacity, fields Product Family, Monthly Max Capacity, Start Date, and End Date.
Demand side
- Join_Facts_Product (Join, Left Outer): match the Fact’s Product to the product’s ID, so every forecast record carries its Product Family.
- Aggregate_Demand (Group and Aggregate): group by Family and PeriodStartDate, and sum Forecasted Quantity as TotalDemand. This adds up all accounts and products of a family in each month.
Capacity side
- Join_Demand_Capacity (Join, Inner): match Family to the capacity record’s Product Family.
- Flag_In_Window (Formula): add a number field InWindow that is 1 when the month falls inside the capacity window:
IF(AND({Period_Start_Date_c}<={PeriodStartDate}, {PeriodStartDate}<={Period_End_Date_c}), 1, 0)
- Filter_In_Window (Filter): keep only rows where InWindow equals 1.
- Aggregate_Capacity (Group and Aggregate): group by Family and PeriodStartDate. Sum the monthly capacity as TotalCapacity, and take the Maximum of TotalDemand and DemandForMonth. The sum combines the plants, and the maximum counts the demand only once when a family has several plants.
Calculation
- Calc_Utilization (Formula): add two fields. UtilizationRatio (Number, 8 digits, 2 decimals):
IF({TotalCapacity}>0, {DemandForMonth}/{TotalCapacity}*100, 0)
StatusFlag (Text, 30):
IF({TotalCapacity}>0, {DemandForMonth}/{TotalCapacity}*100, 0)
Writeback - Join_Facts_Result (Join, Left Outer): join Join_Facts_Product to Calc_Utilization on Family and PeriodStartDate, carrying the Fact UtilizationRatio, and StatusFlag. This gives every forecast record the result of its family and month.
- Writeback_Capacity (Writeback Object): target Advanced Account Forecast Fact, action Update. Map ID to ID, UtilizationRatio to Capacity_Utilization_Ratio__c, and StatusFlag to Capacity_Status_Flag__c.
Activate the definition and click Run Definition. It has no input variables, and it processes all accounts in one run.
Step 4: Review Capacity Utilization in the Forecasting Grid
After the forecast is generated, run the Capacity Utilization Check definition. Then open an account’s Advanced Account Forecast Set Use record (for example, Acme Industries Capacity_Aware_Forecast_Set), go to the Advanced Forecast tab, and select the measure group that contains the capacity measures.
The grid shows Forecast Quantity, Capacity Utilization Ratio, and Capacity Status for each product and month. The Aggregate column shows the maximum across the planning window, so the worst month is visible at a glance.
How to read the results
- Capacity Utilization Ratio is the family’s total demand divided by its combined plant capacity for that month, as a percentage.
- Capacity Status is 0 (within capacity, 100% or below), 1 (at risk, above 100% up to 110%), or 2 (critical, above 110%).
Sample Grid Output
ADVANCED ACCOUNT FORECAST GRID: ACME INDUSTRIES (FY26)
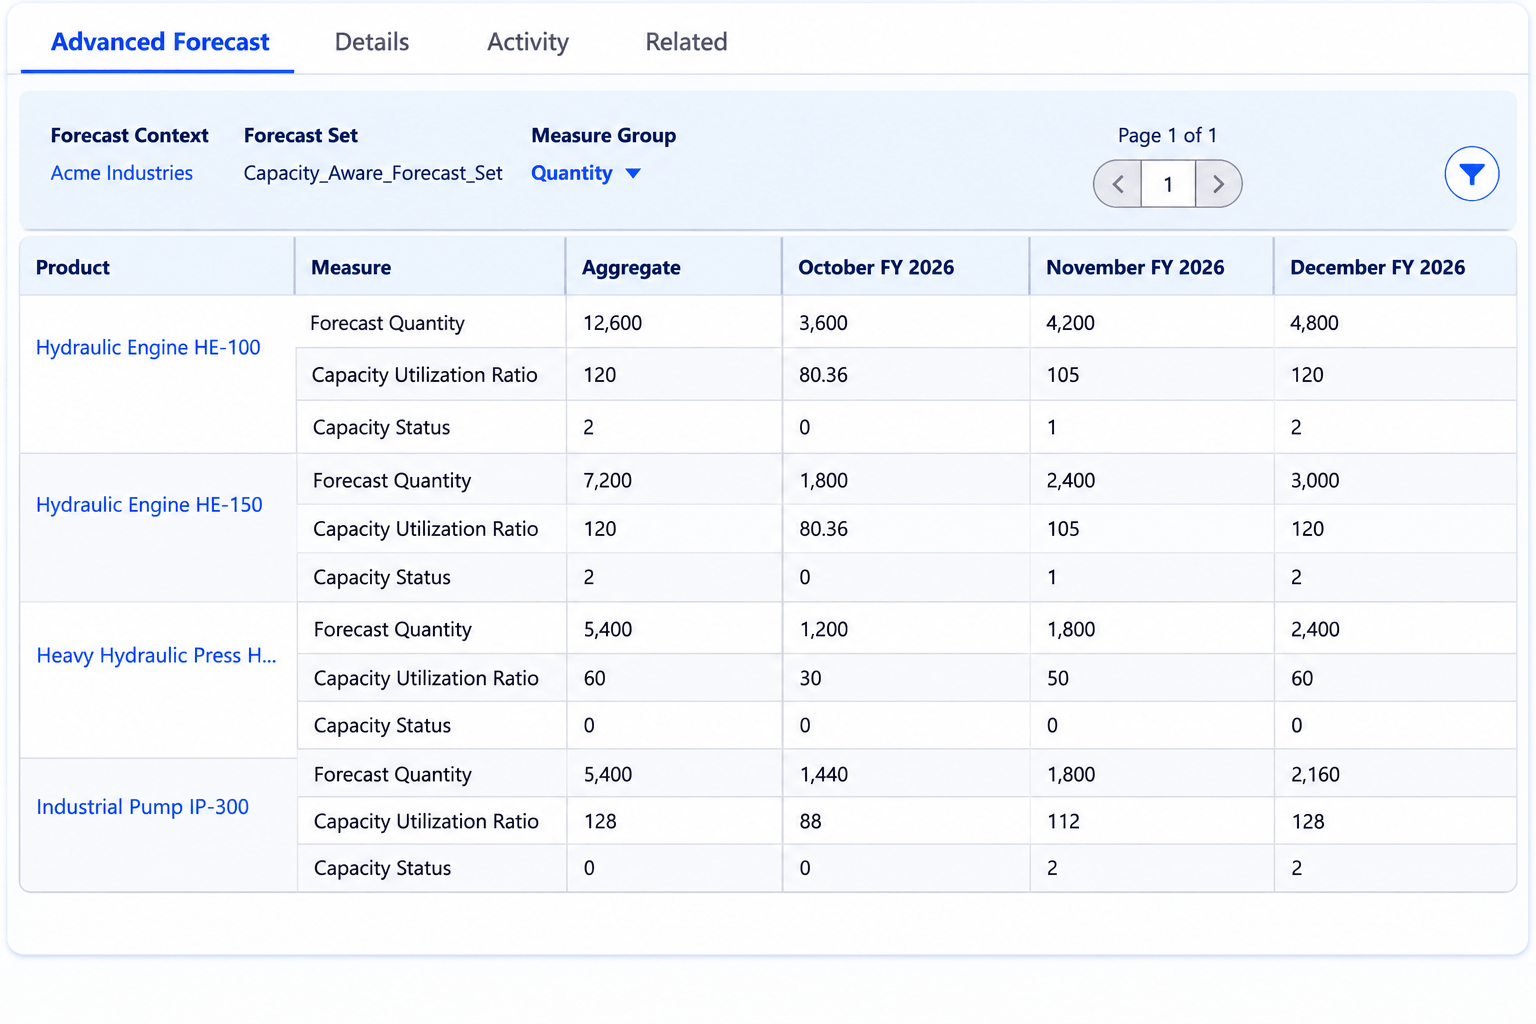
Sample output: Advanced Account Forecast grid for Acme Industries (FY26).
Why both Hydraulic Engines products show the same ratio: utilization is calculated per product family and month, not per product or account. Acme’s Hydraulic Engines demand alone is 5,400, 6,600, and 7,800 units, which is below the family’s combined capacity of 11,200 in every month. But Brightline Manufacturing also orders from the same family (3,600, 5,160, and 5,640 units). Together, the demand is 9,000, 11,760, and 13,440 units, which gives 80.36%, 105%, and 120%. A comparison made one account at a time would have missed the December breach.
Heavy Hydraulics, with 6,000 units of capacity, stays within capacity in every month, which shows that a healthy family isn’t affected by an overloaded one.
Tip: The capacity check runs as a batch job. Run it after each forecast Generate, Recalculate, or Rollover , and after any change to a Plant Capacity record, so the grid reflects the latest numbers.
Business Impact & ROI
By embedding plant capacity directly into Manufacturing Cloud forecasting, manufacturing organizations move from demand-only forecasting to operational feasibility planning.
| Operational Focus Area | Legacy Forecasting Approach | Capacity-Aware Forecasting Engine |
|---|---|---|
| Feasibility Validation | Manual, disconnected periodic spreadsheet reviews | Automated calculation in the DPE, run after each forecast refresh |
| Overload Detection | Overloads found late, when orders reach the plant | Family-level overloads visible per month while the forecast is still being reviewed |
| Sales & Ops Alignment | Sales projections often conflict with shop-floor limits | Demand and capacity visible side by side in one grid |
| Planning Scope | Each account reviewed in isolation | Demand from all accounts and products summed per product family and month |
| Expedite and Rework Costs | Emergency capacity re-allocation after commitments are made | Earlier warning gives teams time to adjust schedules, shifts, or customer dates |
Teams can track their own results after rollout, for example the number of expedited orders or on-time delivery rates. The benefits above describe what the extension makes visible earlier, and they are not guaranteed outcomes.
Summary
Demand forecasting without operational context leads to missed promises and costly plant disruptions. By combining a custom capacity object, a edicated Data Processing Engine definition, and capacity measures in the Advanced Account Forecasting grid, Salesforce Manufacturing Cloud lets sales and operations teams review forecast demand and plant capacity side by side.
Because capacity is validated at the product family and month level, with demand from all accounts and products compared against the combined capacity of the plants that produce the family, overloads that account-by-account checks would miss become visible early.