In current time Facebook has become an easy way to reach and connect with your Customers. Through Facebook’s app and services you can easily get in touch with right people and gather their attentions for the smooth functioning of your business. Facebook Page helps people to connect with your business and Facebook Ads help them to find your business. Facebook provides various metrics related with your Pages and Ads. These metrics contain very useful information. We have discussed these metrics in the description of the charts.
By using these metrics we have build a dashboard in which we have visualized the data for better understanding. We have use Salesforce Einstein Analytics(Wave Analytics) for building the dashboard.
Salesforce Einstein Analytics(Wave Analytics) is a new cloud-based analytics tool that help in creating powerful Chart and Dashboards using your large data. Einstein Analytics allows you to bring in data from your Salesforce orgs, as well as from your other external sources. Data preparation tools provided by the Einstein Analytics allow you to easily manipulate and clean your data. By developing the Dashboard from this data you can track your business.
Following charts have been developed in Einstein Analytics using Facebook Data as per the requirement from one of our client.
-
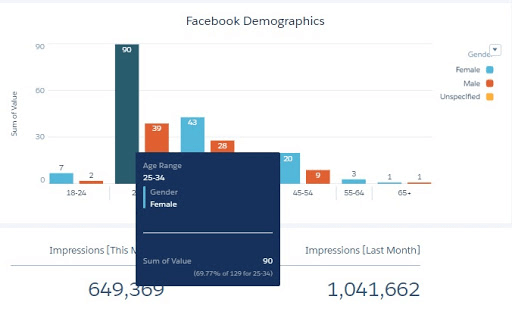
Facebook Demographics:
For this bar chart we have used Facebook Demographics data. FB Demographics tells about age and gender of the people who like your page. Following chart shows the comparative result of Age range and Gender w.r.t. number of likes.
-
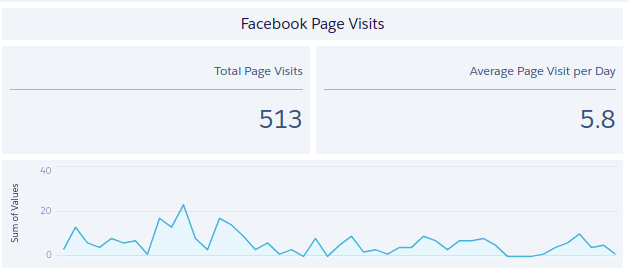
Facebook Visits:
While Facebook provides valuable insights into page visits and user engagement, businesses often need to analyze website behavior alongside social media performance. Integrating website analytics helps in understanding how users interact beyond Facebook.
The following line chart and number widgets shows the total and average page visits for last 90 days by monitoring the Page traffic.
-
Impressions and Clicks:
In this number widget we have used the following metrics:
Impression : The number of times ads were on the user’s screen.
Clicks: Total number of clicks on your ads.
The chart below shows the comparative result of Impression and Clicks(This Month) vs Impression and Clicks(Previous Month).Ad performance metrics such as impressions and clicks indicate engagement, but the real business value lies in how these interactions convert into revenue. Opportunity dashboards help track deal progression, revenue forecasts, and sales performance derived from marketing campaigns.

-
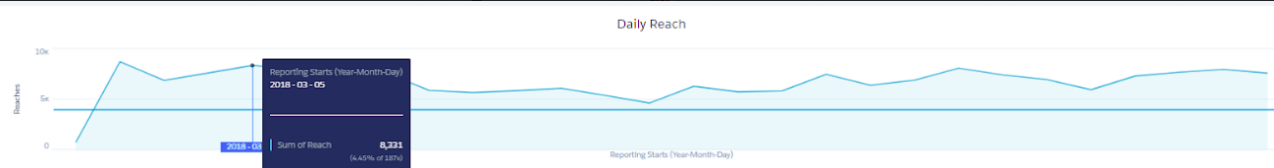
Daily Reach:
The following line chart displays the number of people who have seen post from your Facebook Page.
-
Facebook CPP & CPM:
CPP: Cost per Pixel.
Pixels are used to track events on a website. By using these pixel you can track the activity of your audience for targeted offers.
CPM: Cost per 1,000 impressions i.e. average cost paid by you to have 1,000 impression on your ads.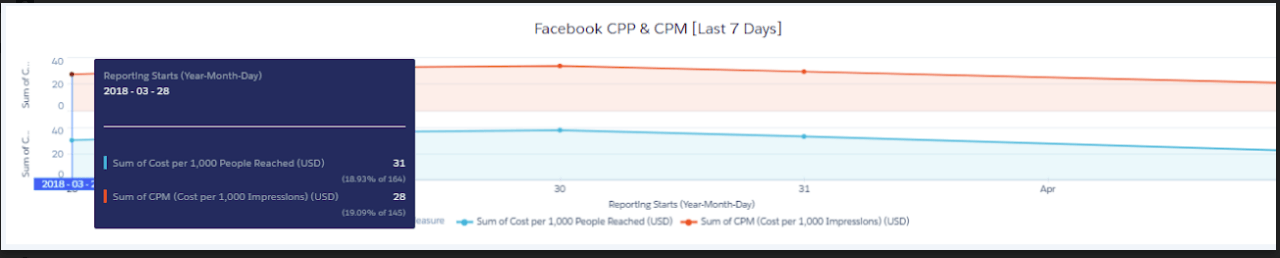
-
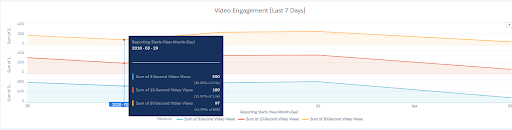
Facebook Video Engagement:
Understanding audience demographics is crucial, but converting that audience into potential customers is the ultimate goal. By combining Facebook engagement data with CRM lead analytics, businesses can track how social media interactions generate leads and measure conversion effectiveness.
This Timeline chart shows the number of times posted video was watched by audience for an aggregate of the following times:
- 3 sec video watched
- 10 sec video watched
- 30 sec video watched
or for nearly its total length, whichever happened first.
The Image shown below is the complete visualization of the Facebook Dashboard on Einstein Analytics. We can add dynamic filters for the date presets so the data will change according to the filter applied on it.
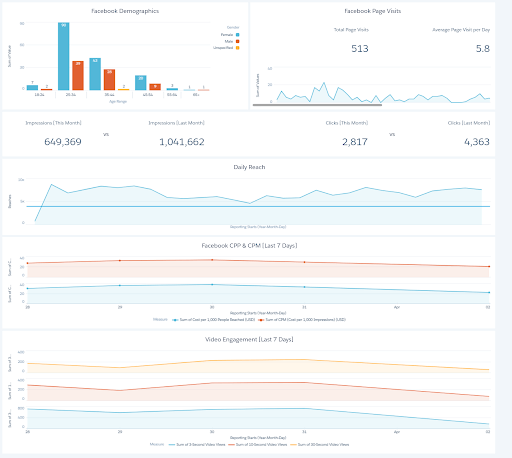
The true strength of Salesforce CRM Analytics lies in its ability to unify data from multiple platforms such as Facebook Ads, CRM systems, and external data sources. This integration enables businesses to analyze the complete customer journey—from initial engagement to final conversion—in a single dashboard. To explore how seamless integration enhances analytics capabilities, refer to our article CRM Analytics Salesforce Integration page.
For any queries on Einstein Analytics, please contact sales@astreait.com