Salesforce Einstein Analytics is another cloud-based analytics tool that aids in making effective Chart and Dashboards utilizing your vast information. Salesforce Einstein Analytics enables you to get information from your Salesforce orgs and in addition to your other External Sources. Data preparation tools given by the Einstein Analytics enable you to effectively control and clean your information. By building up the Dashboard from this information you can track your business.
It offers an application for each line of business by means of Sales Analytics and Service Analytics.
In this article, I’ll discuss the overview of the Salesforce Einstein Analytics components.
Let’s start. The first step is to get a new developer org. If you are already having one still it’s recommended to use a new developer org by using the following link:
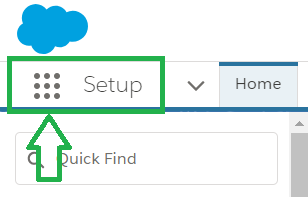
https://developer.salesforce.com/promotions/orgs/wave-deLogin to your org and click on the App Launcher icon which is on the upper left side of the page as shown in the image below. (If you are using Salesforce Lightning)
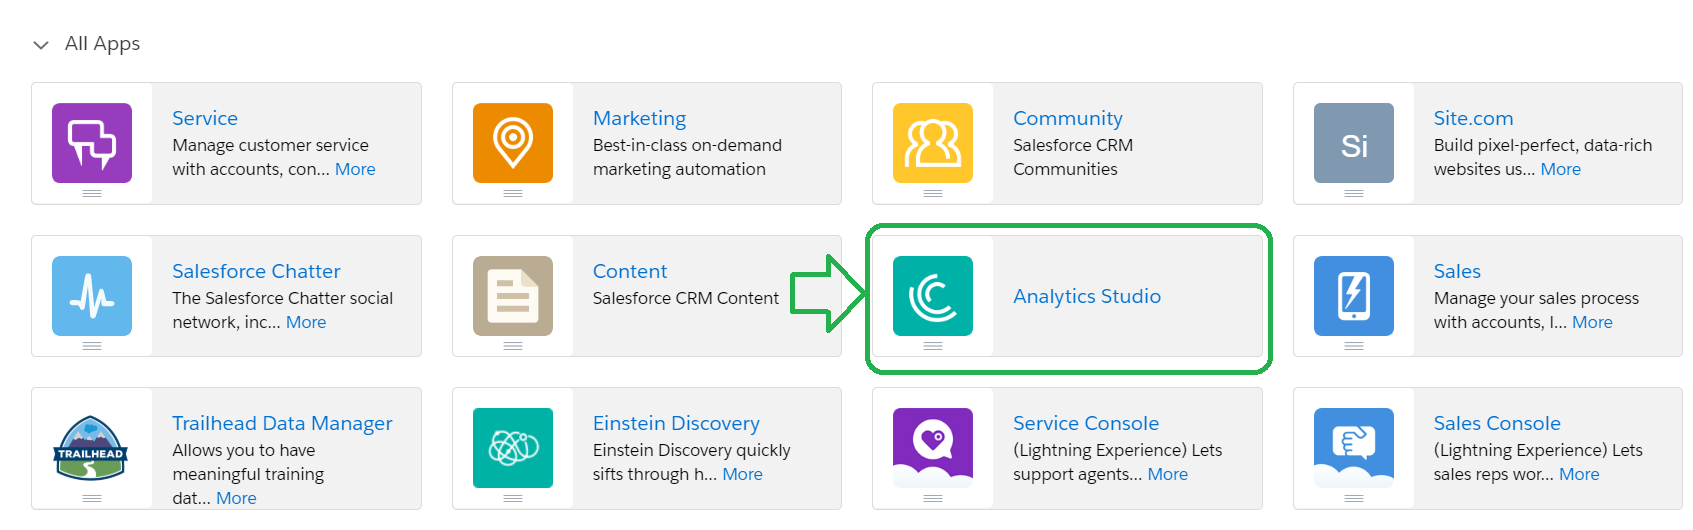
A new window will prompt and you need to find and click on Analytics Studio tile as displayed in the following image.
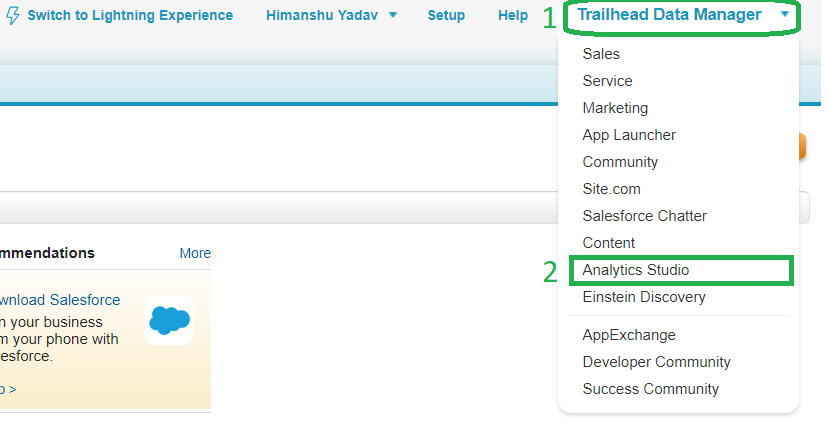
If you are using Salesforce Classic then use the following image for your reference.
After performing above steps you will see a screen something like the below image.
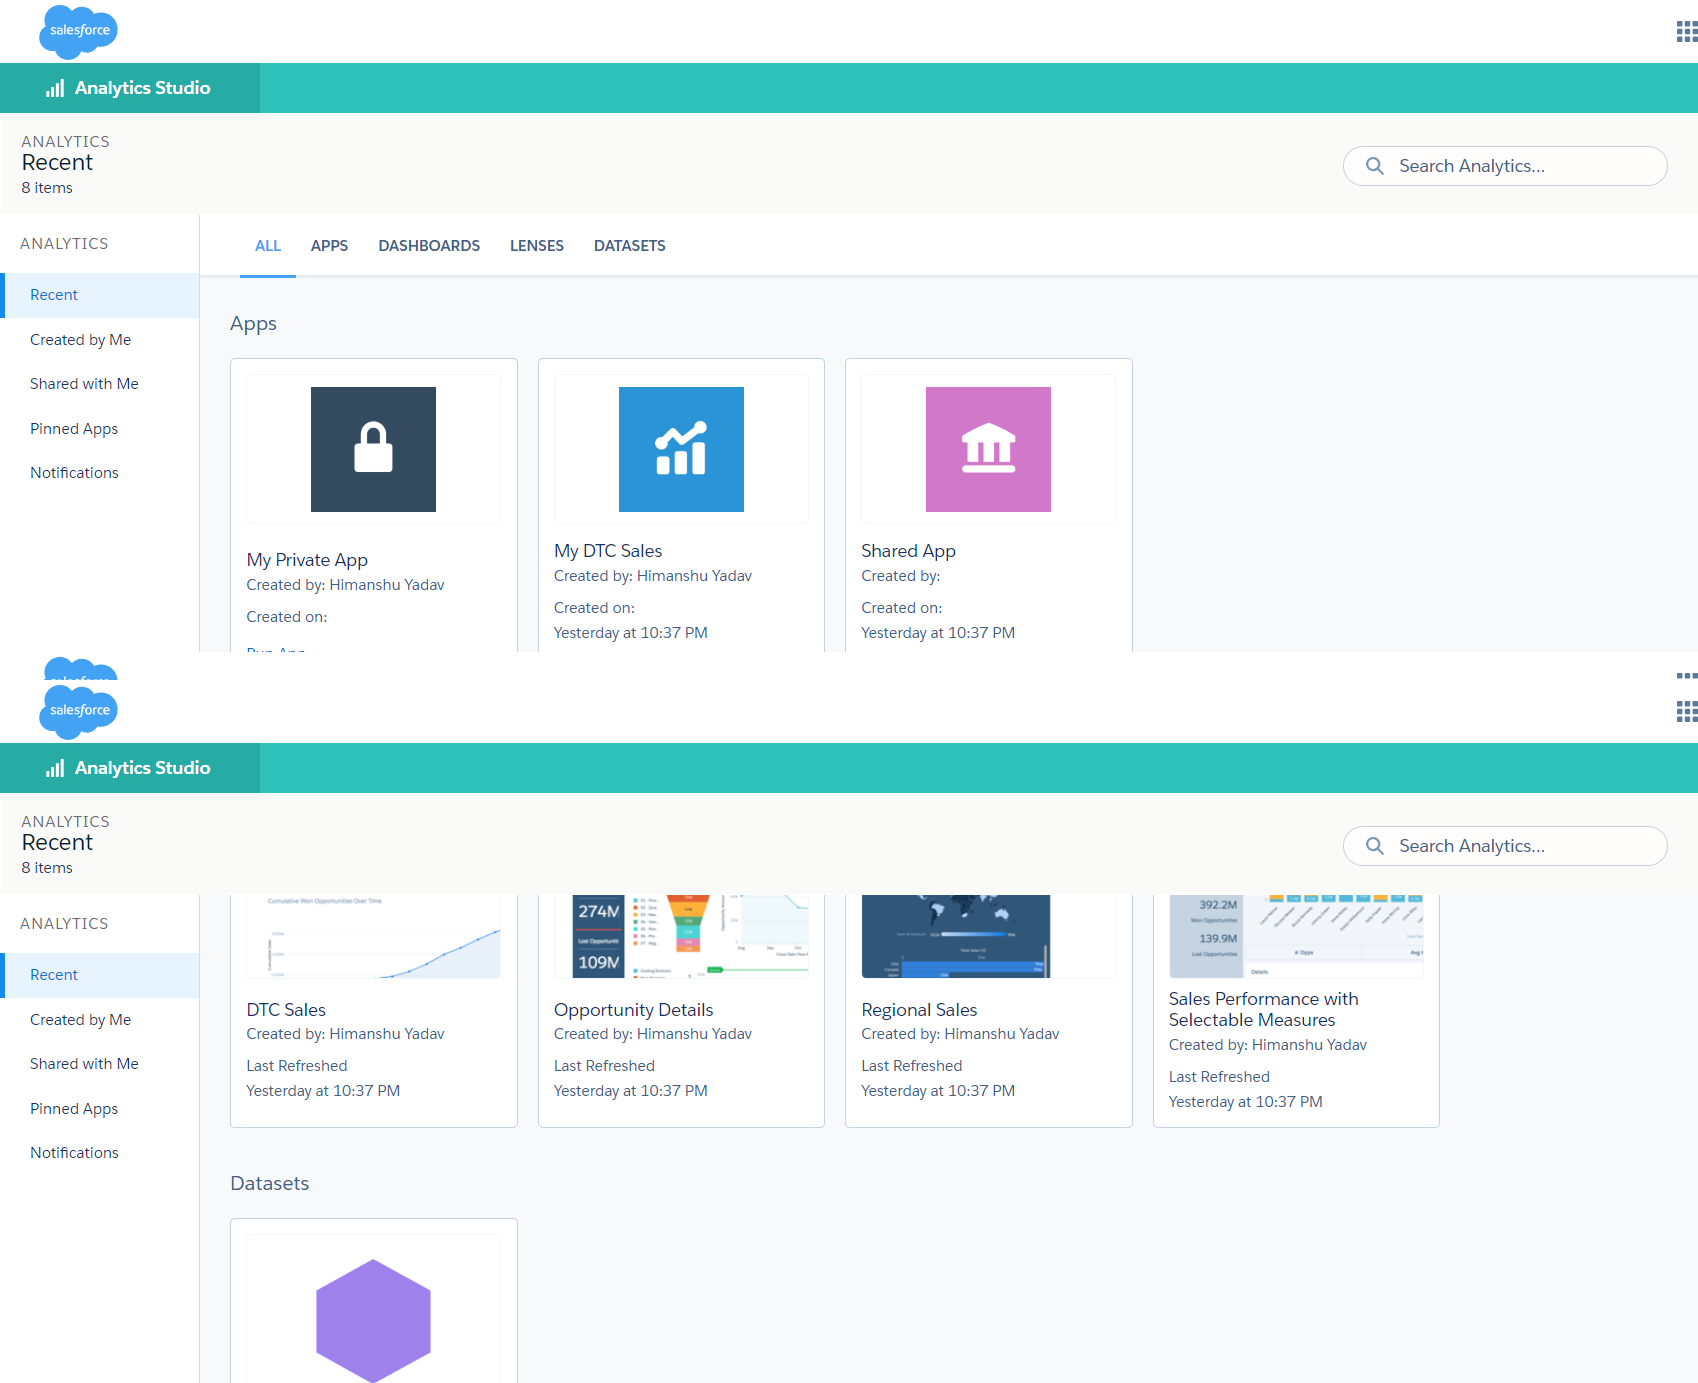
Congrats! You are inside the analytics studio and ready to develop your first dashboard.
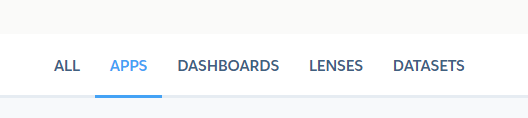
Most of the things are easy to understand but maybe you’ll have some question regarding APPS, DASHBOARDS, LENSES, DATASETS. So what are these? Yes, you are in the right direction and let me boost your speed for your destination. These are Analytics Assets and I am going to tell you about these in the article. So let’s start with Apps.
Apps provide readymade Dashboards populated with Salesforce Data that gives you visual summary of data.
An app is the collection of rest of the Analytics Assets which are Dashboards, Lenses, Datasets.
Apps make it easy to create and group various Dashboards, Lenses and Datasets in relevant order so that you can easily share it with your groups.
By default following apps are available in your developer org:
Private app is not shareable i.e. it’s only visible to you. So all the work-in-progress, which are not ready yet are stored in this app.
Anyone having access to analytics in your org can have access to it but still you can impose permission for the security. It’s just the opposite of My Private App.
It’s a sample app provided by the Salesforce to you, to get into and learn the Einstein Analytics.
You can also create your own app and decide the security of the app.
Set of charts, metrics and tables is known as Dashboard which gives you interactive visuals of your data. Later on you will get to know more about dashboards.
Dashboards are one of the most powerful components of Einstein Analytics, providing interactive visualizations of business data. To explore more advanced dashboard designs and use cases, Salesforce offers various capabilities to customize dashboard pages for better insights and storytelling.
Lens is a saved step or exploration. These can be known as the basic building block of the dashboard. While developing a dashboard, Lens is the second basic asset after the dataset.
Dataset is the source of data which is optimized and specially formatted. Datasets are used to build the Lens and Dashboards. So, that was the brief introduction of the Analytics Assets. Click on any of the tab to get that type of asset.
Efficient data processing is essential for building high-performing dashboards. Salesforce uses SAQL (Salesforce Analytics Query Language) to query datasets and generate insights. Optimizing SAQL queries can significantly improve dashboard performance and responsiveness.
The best way to learn is to get it done by yourself. Are you Ready? Okay let’s start
So what is the first thing we need to build? A Lens, a dataset, a dashboard or an app? What you think? Raise your hand who are saying an app. Congratulations! You are right. Those who were saying that a dataset or a dashboard don’t be sad. You might be thinking that dataset is source on which we will plot our Lenses and Dashboards. That is right in the case where we wanted to build a dashboard on any existing app or dataset. But in this case we are starting from scratch. So first we need a container where we will store everything and that is an App in our case.
- On the homepage of analytics, click on the Create button at the upper right corner.
- Select App then Blank App and click Continue.
- Give the name for your app and click on Create
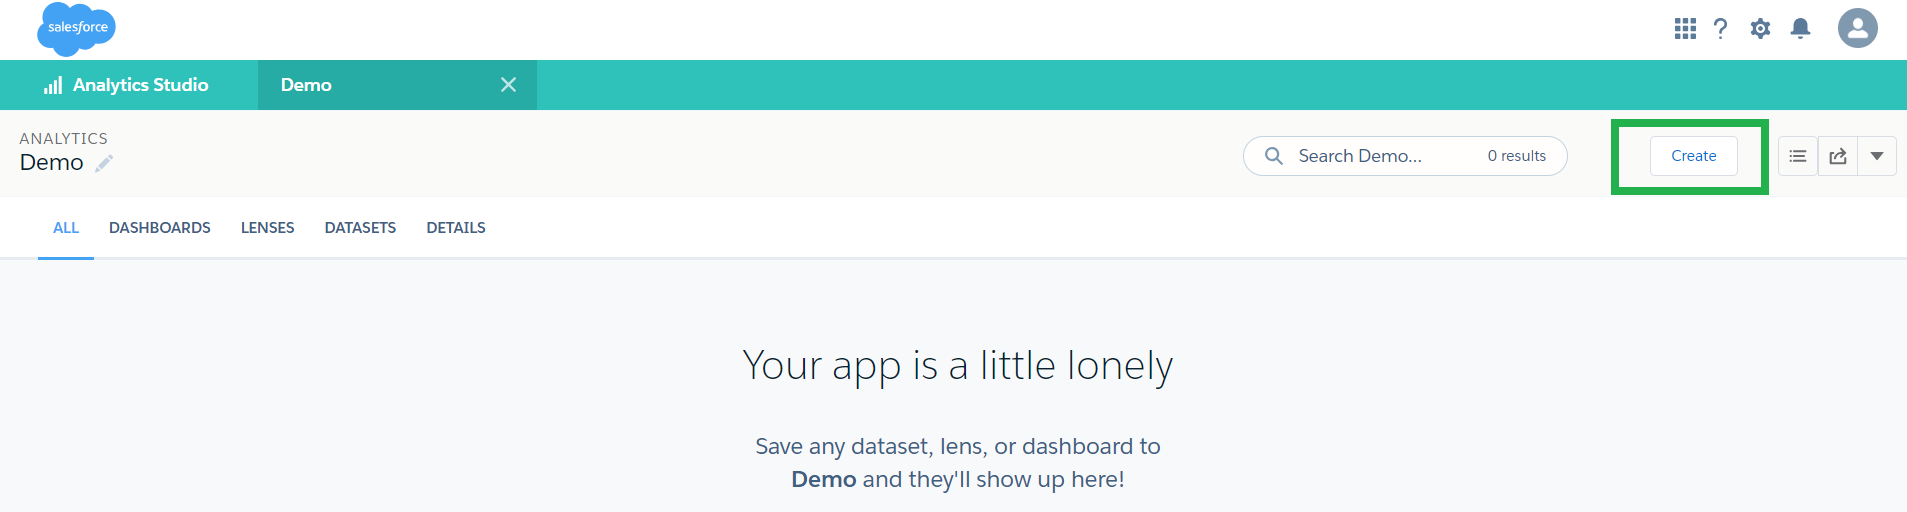
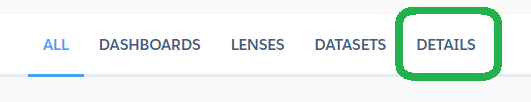
Your app is ready. You can add or alter other details by clicking the Details Tab.
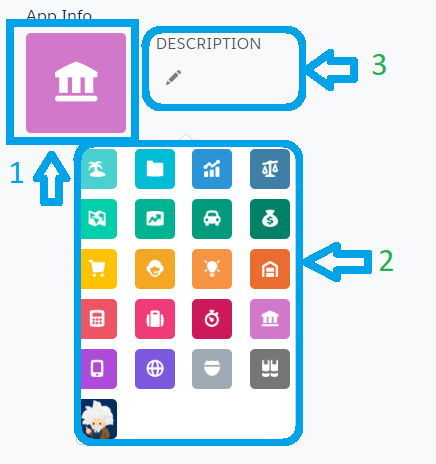
To customize the icon do the following:
- Step 1: Click on App’s icon. (step 1 in the below image)
- Step 2: Select any appropriate icon which is suitable for your app.(step 2 in the below image) To Add the Description double click on the Description Area(step 3 in the below image).
Now it’s time to create our Dataset.
In Einstein Analytics you can create a dataset using Salesforce Data as well as data from external sources which is in CSV format. To create a dataset do the followings:
- On the Homepage of Analytics App, click the Create button at the upper right corner.
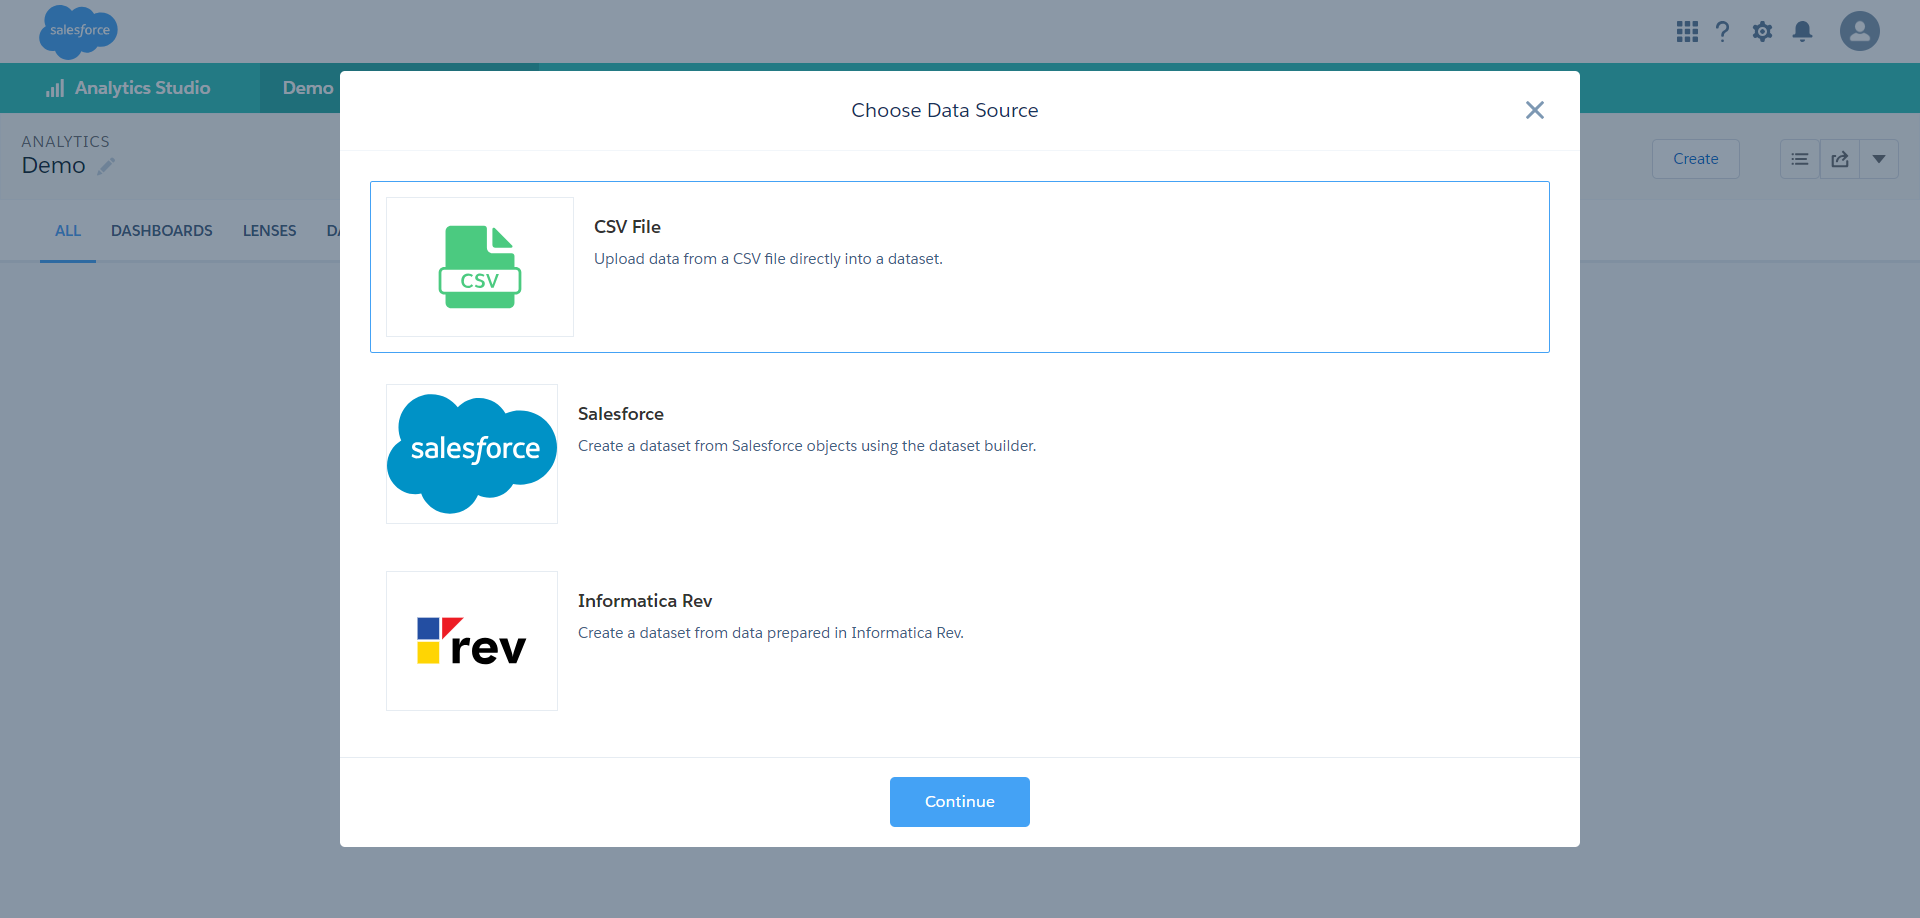
- Select Dataset and a new window will be prompted asking you to choose Data Source.
- If you want to upload a CSV file then choose CSV file.
- If you want to use Salesforce Data click on Salesforce.
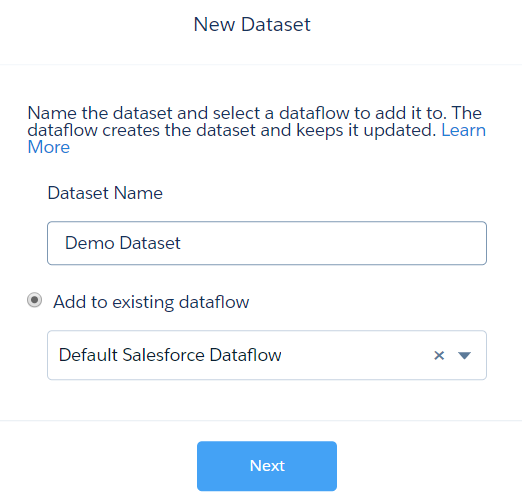
- When you click on Salesforce it will ask you to give a name to your dataset and select a Dataflow(Dataflow is a advanced topic in Einstein Analytics and I am not going to describe it into this article.) i.e. Default Salesforce Dataflow for now and click on Next.
- A new tab will open and where you can choose your Salesforce Object. Opportunity is our object for this article.
- When you will select Opportunity object, the page will be like below image:
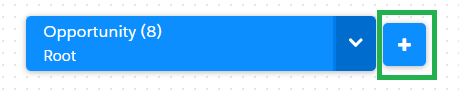
- Move your cursor to the down arrow sign and you will find the plus icon. Click on it and select the fields which you want in your dataset and click on Next.
- Select the Demo App for Dataset and click on Create Dataset. You will get the following information:
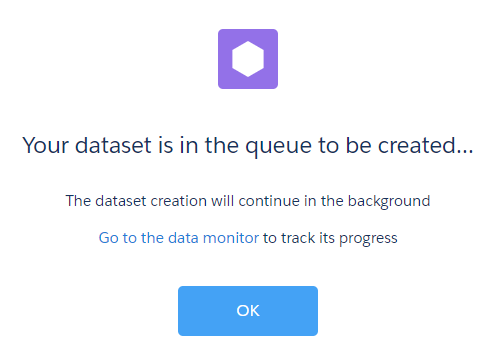
- You can check the status of your jobs by clicking on the Go to the data monitor link.
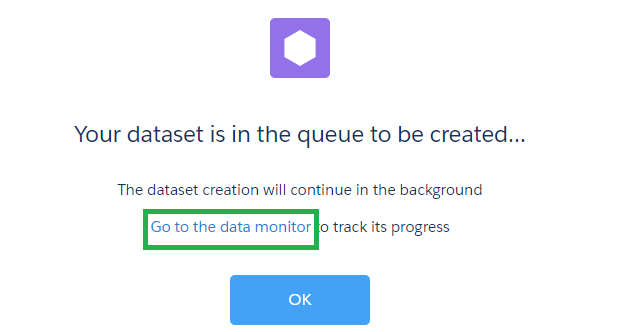
-
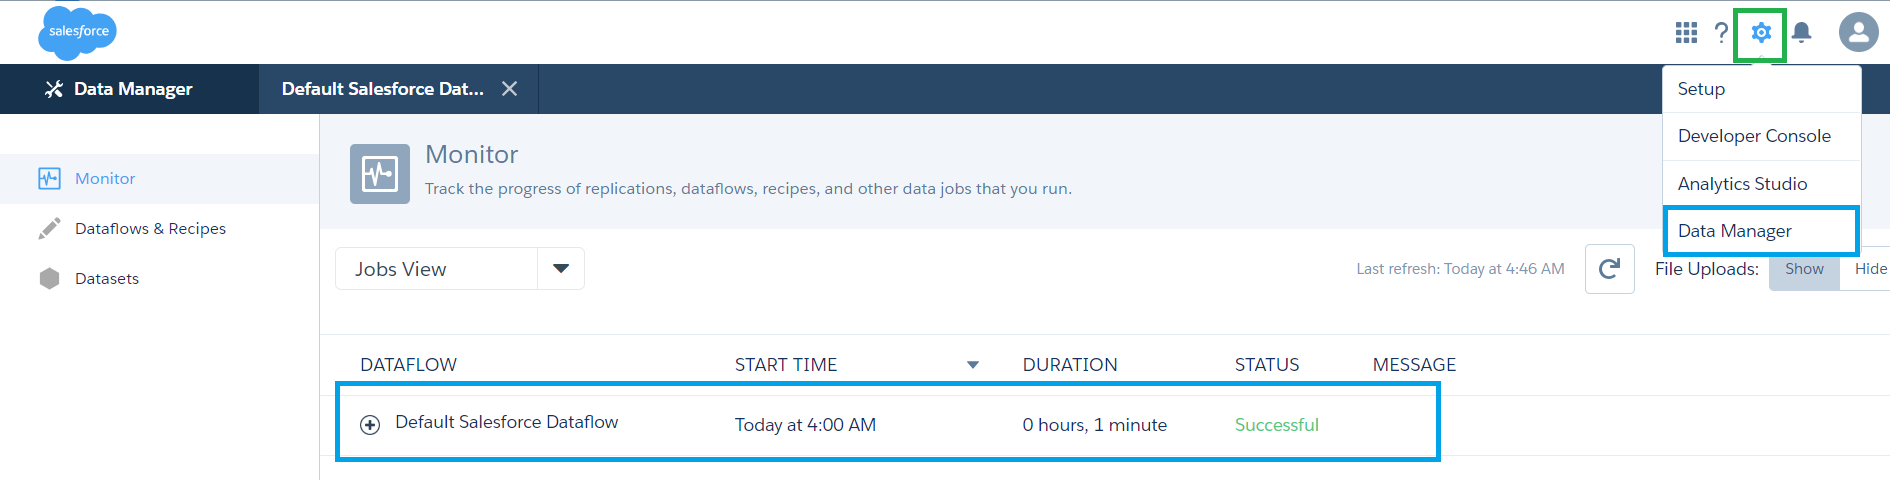
Or Click on Gear Icon at right upper side and then select Data Manager.
- Now our Dataset is ready. Go to the Homepage of Demo App and click on the Dataset tab and you will find the Demo Dataset.
Now we will create a Lens using the Demo Dataset.
- Click on the Demo Dataset and you will get a page like this
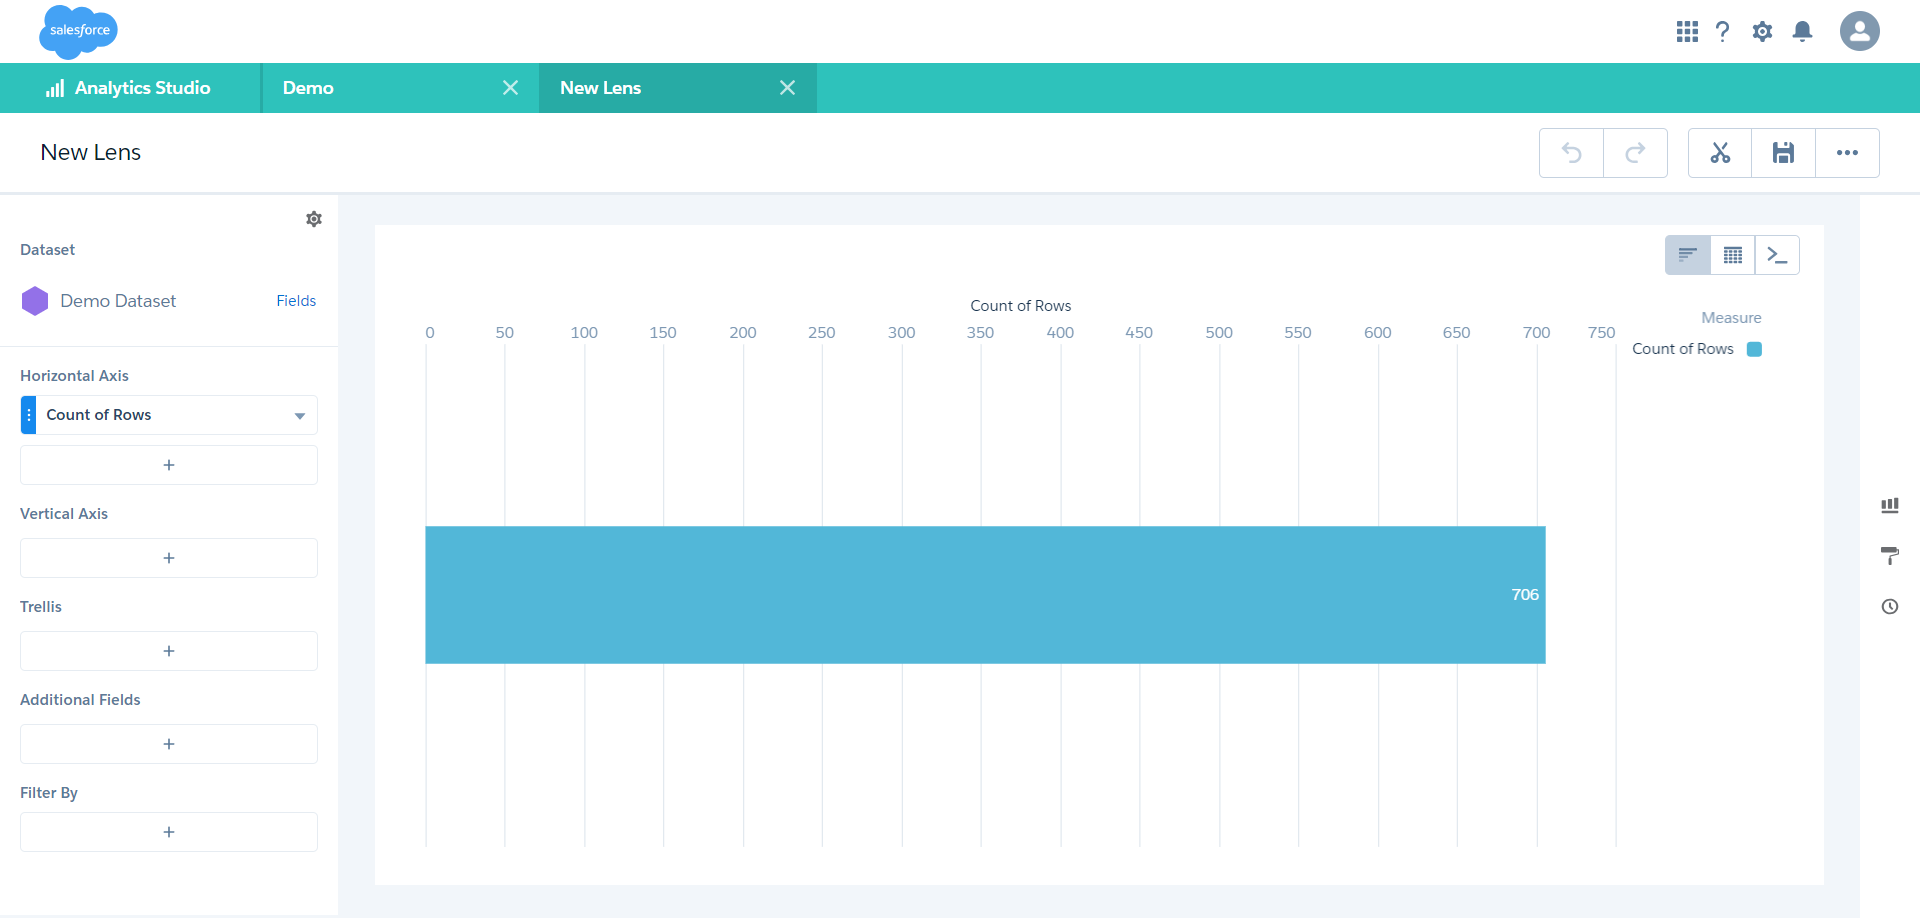
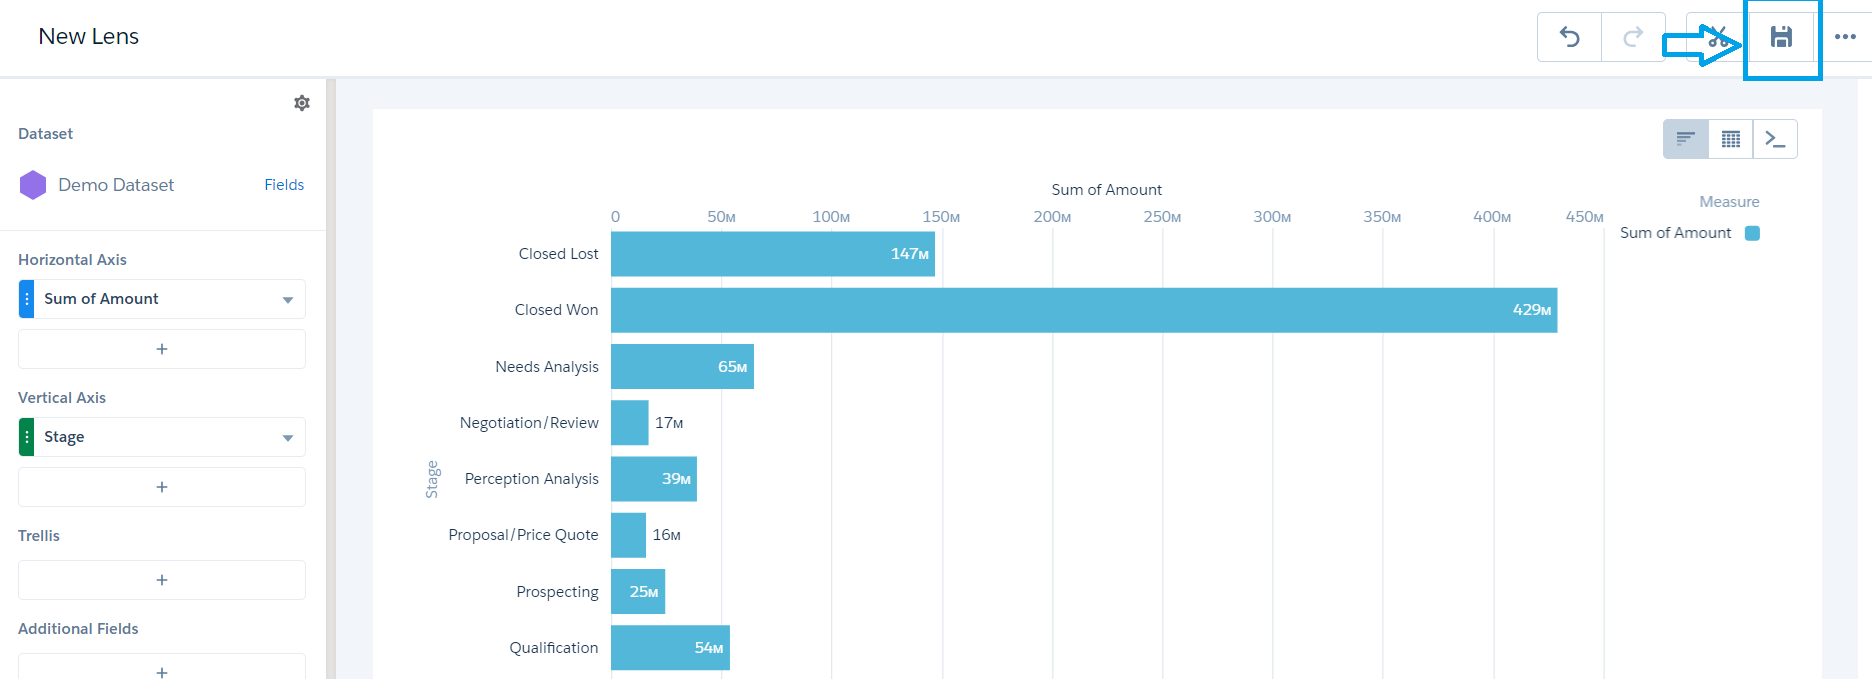
- By default it shows the number of row count which are 706. Let’s change it. In the Horizontal Axis select the Sum of Amount instead of count of rows.
- In Vertical Axis select the Stage.
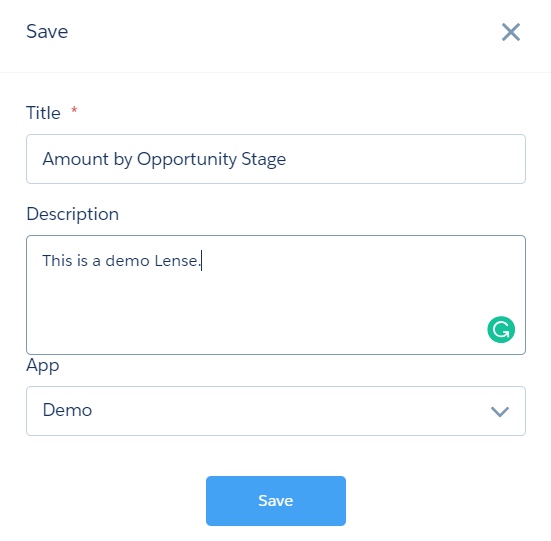
- Click on the Save button and give a name to your lens, select the Demo app and click on Save.
Now under the Lens tab you can find a Lens “Amount by Opportunity Stage”.
To describe everything about building a Dashboard is beyond the scope of this article. But I will give you an overview so that you could find it easy to get started with the Dashboard building in EA. Until I write a new Article on Dashboard do some practice with the basics which I am going to tell you in this section.
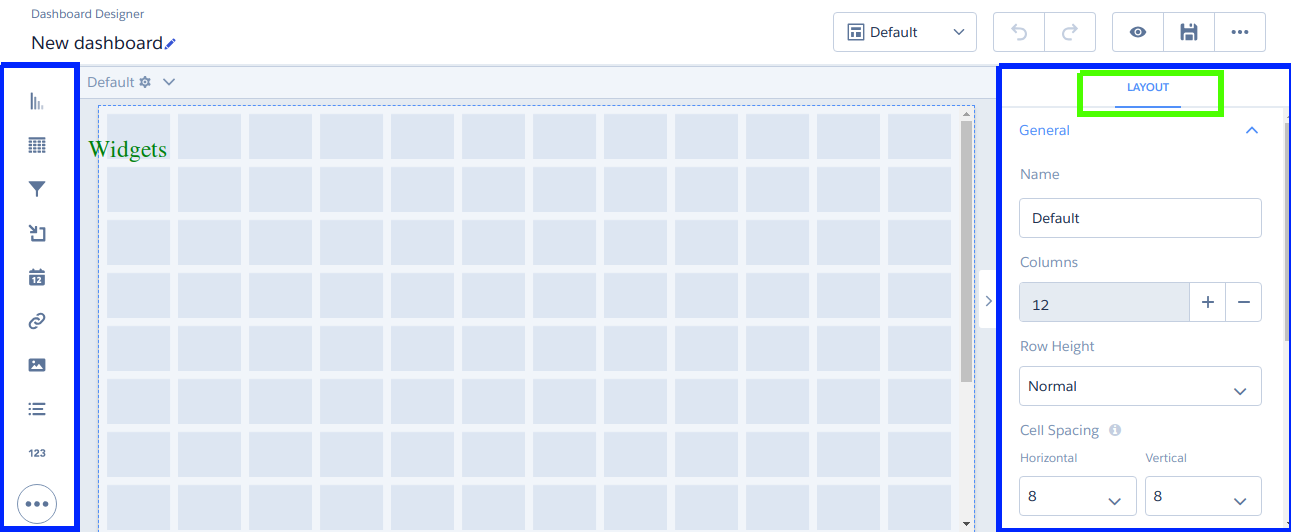
- Click on the Create button and select Dashboard. Select Blank Dashboard and click on Continue. Now you are in playground and let’s start playing.
- Widgets are in the left side of your screen and these are used to build charts and metrics. Drag any widgets which is suitable for you
- In the right side of your screen you fill Layout Editor. It’s used to edit the layout of your Dashboard.
- Let’s Drag the top widget which is Chart. Click on Chart and select a Dataset. A new window will open which is identical to the previous step in lens. You can change the type of chart by clicking on Chart Type.
- Explore and check, what you can do more by yourself. You can preview your Dashboard by clicking on the Preview Button at right upper corner.
- Click on the save button, give a Title to your dashboard and select Demo App from App dropdown menu.
Once dashboards are created, organizations often need to make them accessible within Salesforce interfaces. Einstein Analytics allows embedding dashboards directly into Lightning Experience and Visualforce pages, making it easier for users to access insights within their workflow. This improves usability and adoption across teams.
Congratulations on your first Einstein Analytics Dashboard. You can learn a lot by doing it yourself.
So, that was a brief overview of Einstein Analytics. Now you have got the basic idea about Apps, Dashboards, Lenses and Datasets. Start digging and make some interesting Dashboards. Want to see the power of Einstein Analytics Dashboard, select the My DTC Sales App from All tab and preview the Dashboards.
Einstein Analytics supports integration with multiple data sources, including Salesforce and external systems. Proper integration ensures seamless data flow and enables comprehensive analytics across platforms. Salesforce CRM Analytics Integration provides advanced capabilities to unify and analyze data effectively. To learn more about integrating analytics with Salesforce, refer to our article CRM Analytics Salesforce Integration Page.
Go and visit the following links for more interesting Dashboards on Einstein Analytics developed by Astrea IT Services.
- https://astreait.com/Google_Analytics_Dashboard_on_Einstein_Analytics/
- https://astreait.com/Salesforce_Opportunity_Dashboard_on_Einstein's_Analytics/
Keep visiting https://astreait.com/blogs/ for more knowledge related to Salesforce.
For any queries on Einstein Analytics, please contact sales@astreait.com.