1. Introduction
Picture an account owner preparing for a quarterly review. The Opportunity looks healthy. Invoices are being paid. On paper, everything is fine. But in the product, only a handful of people log in, and nobody has opened a session in weeks.
Now picture the opposite: a customer with heavy product usage, but unpaid balances and a growing pile of support cases. Each system tells a true story. None of them tells the whole story.
The data is rarely missing. Salesforce holds the relationship and commercial activity, the ERP holds orders, invoices and payments, and product telemetry shows how customers actually use the service. They simply never meet in one place.
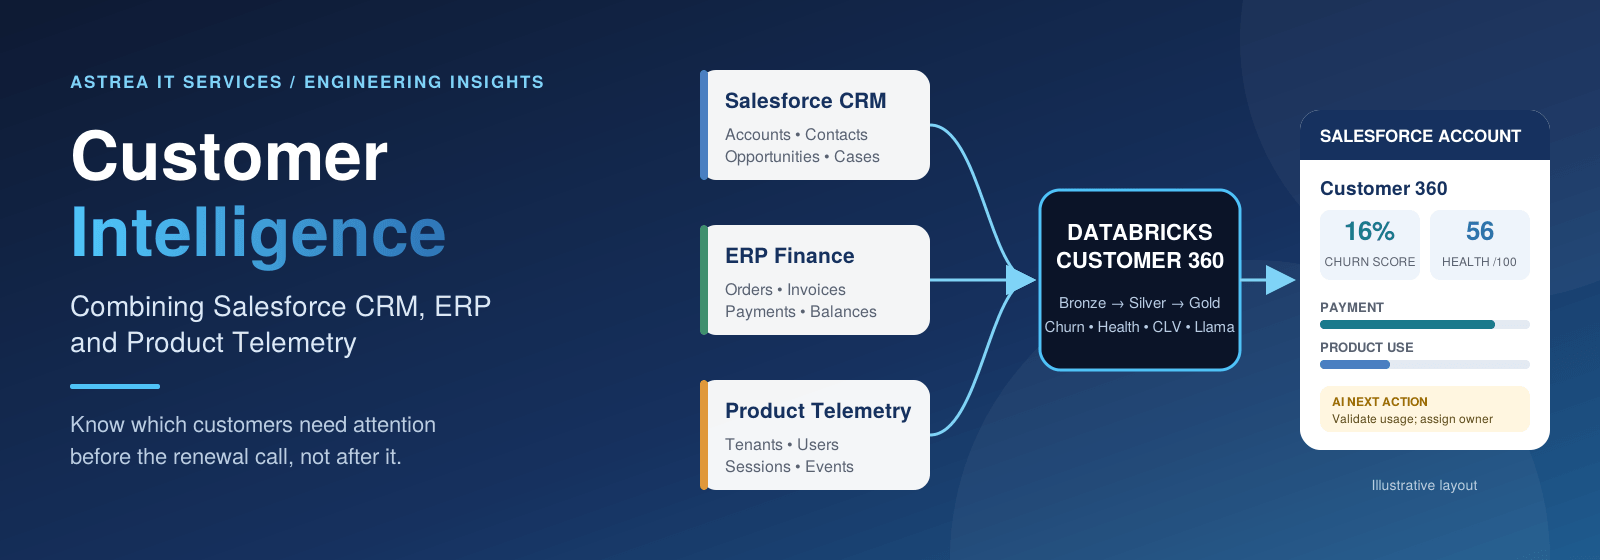
In this blog, we show how we built a Customer Intelligence solution on Databricks that brings all three together. It builds one Customer 360 record per Salesforce Account, scores eligible accounts with an experimental B2B churn model, calculates value and health indicators, and uses Meta Llama to explain each account in plain language. The results come back to the Salesforce Account page, where account owners already work.
NOTE
A working proof of concept, honestly labelled
This is a technical POC. The churn model is trained on synthetic data, and only a small share of accounts currently have complete ERP and telemetry links. We say so throughout, because a score is only useful when you know how much to trust it.
2. Business challenge
Most organizations already have the data they need. What they lack is a way to see it together, early enough to act. In practice, five problems keep coming up:
- Fragmented customer context: account, sales, finance, service and product signals are maintained in separate systems.
- Reactive retention: teams may identify risk only after a customer raises an issue or stops using the product.
- Incomplete financial visibility: payment history, invoice balances and recent payment trends are not normally reviewed beside product engagement.
- Manual account prioritization: account owners must assemble multiple reports before deciding which customer needs follow-up.
- Unexplained model scores: a number alone does not tell a Customer Success manager which evidence is available or what action to take.
This solution is designed around those five gaps.
3. Three sources, one picture
Each source answers a different question. On its own, none of them is enough.
| Source | What it tells us | What it misses |
|---|---|---|
| Salesforce CRM | Who the customer is, open and won opportunities, contacts and support cases. | Whether they pay on time and whether they actually use the product. |
| ERP finance | Orders, invoices, payment amounts and balance due. | How the customer feels and how the product is being used. |
| Product telemetry | Active users, sessions, events and product tiers. | The commercial context and the financial relationship. |
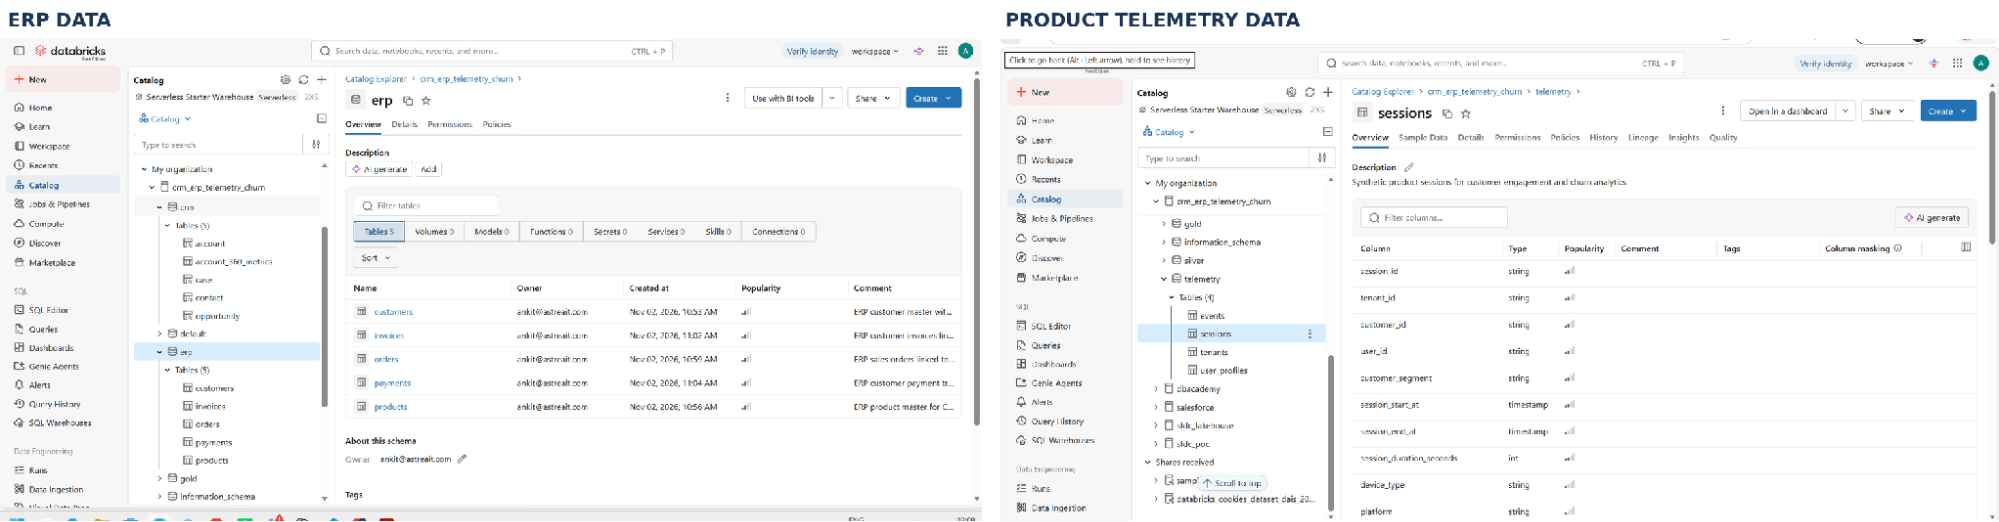
Together they answer the questions an account owner really asks: Is this customer valuable? Are they engaged? Are they paying? And what should I do next?
4. Solution architecture
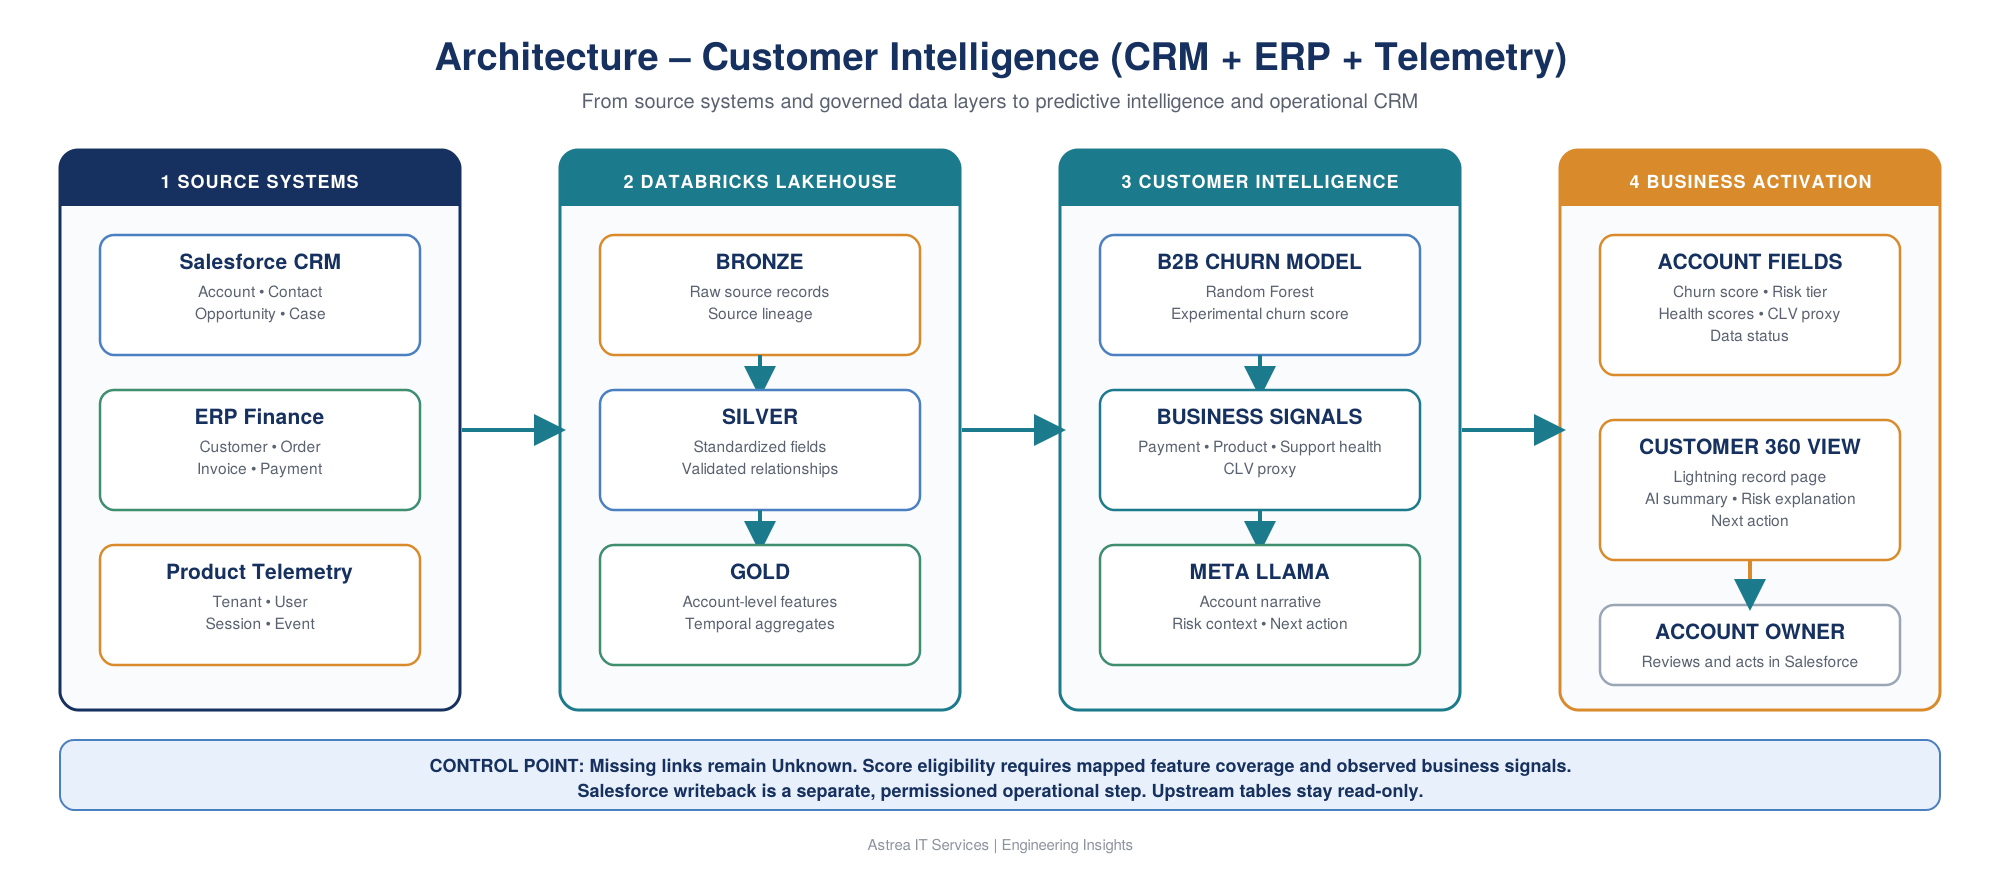
The design keeps analytics and daily CRM work separate. Databricks prepares, scores and explains. Salesforce stays the place where people manage the relationship.
- Salesforce CRM: Account, Contact, Opportunity and Case data.
- ERP and product telemetry: customer, order, invoice and payment records, plus tenant, session and event data.
- Databricks Lakehouse: the existing Bronze, Silver and Gold layers, reused as they are.
- Customer intelligence: a B2B Random Forest churn model, business-health and CLV indicators, and Llama explanations.
- Salesforce Account page: custom fields and a Customer 360 component for review.
5. Step 1: Link the right records
The grain of the solution is the Salesforce Account. Every ERP customer and every product tenant must be linked to an Account through a verified relationship field. Matching by similar names is not good enough, because a wrong join quietly poisons everything downstream.
DATA CONTRACT
Missing is not zero
An account with no ERP link is not a customer with zero payments. A linked tenant with zero events is different from no tenant at all. The scorecard keeps source-coverage flags and nulls so the business can tell missing evidence from real inactivity.
6. Step 2: Reuse the medallion layers
We did not build a new pipeline. Raw CRM, ERP and telemetry records already sit in the Bronze layer of the crm_erp_telemetry_churn catalog. Silver standardizes them and validates relationships. Gold holds the unified account population and its temporal business features, in the universal_temporal_business_features table.
Upstream tables stay read-only. The scorecard itself is written to a single path-backed Delta location, so the existing pipeline is never disturbed.
7. Step 3: Build the Customer 360
Customer 360 joins commercial, financial, service and product signals into one record that keeps the Account ID, name, source coverage, descriptive indicators and the AI narrative together.
| Domain | Representative fields | How it is used |
|---|---|---|
| CRM and sales | Account type, industry, contacts, open/won/lost opportunities, open pipeline, win rate | Commercial context |
| ERP finance | Orders, invoices, payment count and amount, recent payments, balance due | Payment activity and value proxy |
| Product usage | Tenant count, active users, sessions, events, last activity, product tiers | Engagement and adoption |
| Support | Open, escalated and high-priority cases, SLA violations | Service pressure |
| Data quality | Source linkage, feature coverage, proxy notes, scoring status | Prevents false confidence |
8. Step 4: Train the B2B churn model
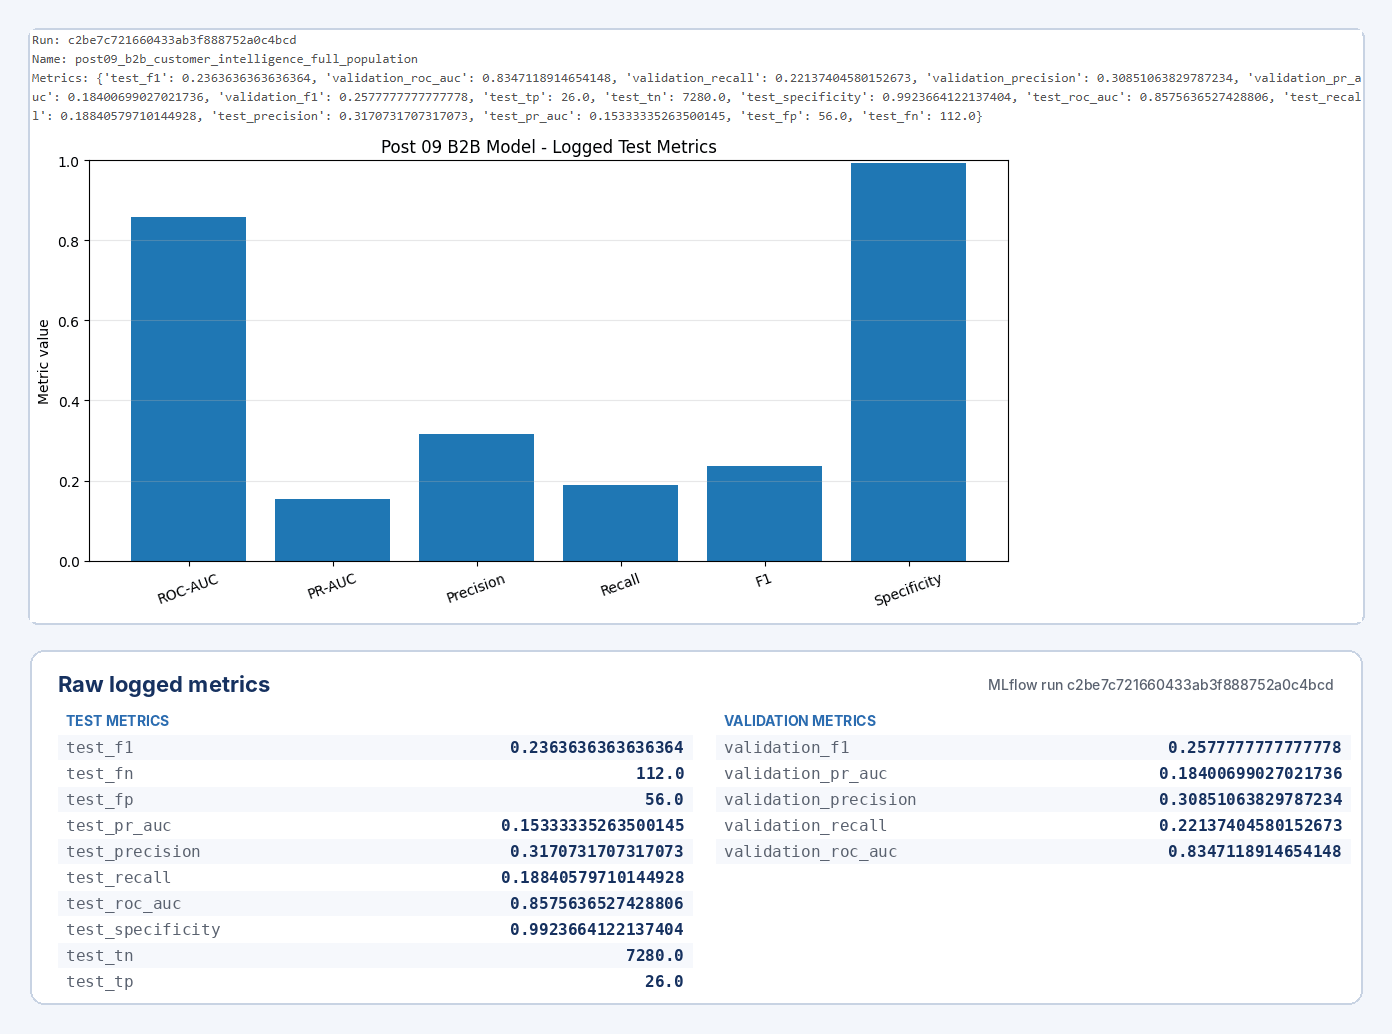
The model is a weighted Random Forest with 150 trees and a maximum depth of eight, trained on 50,000 synthetic B2B SaaS records. Only 916 of them are churn examples (about 1.8%), so class weighting is applied. Data is split 70/15/15 using a stable Customer_ID hash so the same customer never appears in two splits. The decision threshold is chosen on the validation set by F1 score and then fixed before the test set is touched.
| Numeric features | Categorical features |
|---|---|
| Monthly Recurring Revenue | Industry |
| Active Seats Used | Country |
| Total Seats Allowed | Company Size |
| Support Tickets (30d) | Plan Tier |
| Feature Adoption Rate (%) | Billing Cycle |
| Account Tenure (days) | Payment Status |
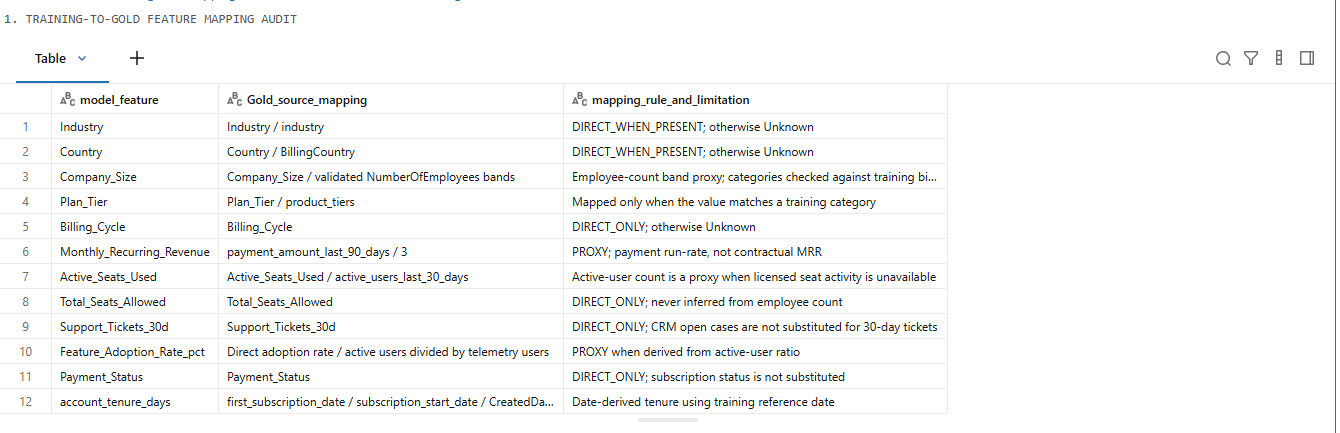
Mapping Salesforce data to the model
Not every training field has a perfect match in the Gold layer. Where we use a proxy, we record it instead of hiding it:
- 90-day payment amount divided by three stands in for monthly run-rate. It is not contractual MRR.
- Active product users can stand in for active seats only when licensed-seat activity is unavailable.
- An active-user ratio can proxy feature adoption when no direct measure exists.
- 30-day ticket counts, seat capacity, billing cycle, payment status and country stay unknown when no valid mapping exists.
- Tenure comes from an observed subscription or account creation date. Missing dates are never turned into zero.
What the model relied on
Feature adoption, support tickets and payment status lead the importance ranking. The four top entries together carry about 70.56% of the reported importance.
| Feature | Importance |
|---|---|
| Feature Adoption Rate | 26.60% |
| Support Tickets (30d) | 17.22% |
| Payment Status: Active | 13.69% |
| Payment Status: Failed | 13.05% |
| Active Seats Used | 7.40% |
| Account Tenure | 3.62% |
| Total Seats Allowed | 3.39% |
| Monthly Recurring Revenue | 2.60% |
NOTE
Importance is not attribution
These values show how much the forest relied on each feature. They do not show whether a value raises or lowers churn risk, and they do not prove cause. Local explanation methods are needed before making account-specific causal claims.
9. Step 5: Estimate value and health
A churn score alone does not tell you whether an account is worth saving. So we add two transparent layers, neither of which is a trained model.
Customer value proxy
| Measure | Rule | Meaning |
|---|---|---|
| Monthly run-rate | 90-day payment amount ÷ 3 | Recent average monthly payment |
| Projected 12-month value | Monthly run-rate × 12 | Forward gross payment proxy |
| CLV proxy | Historical amount + projected 12-month value | Indicative value, not finance-grade CLV |
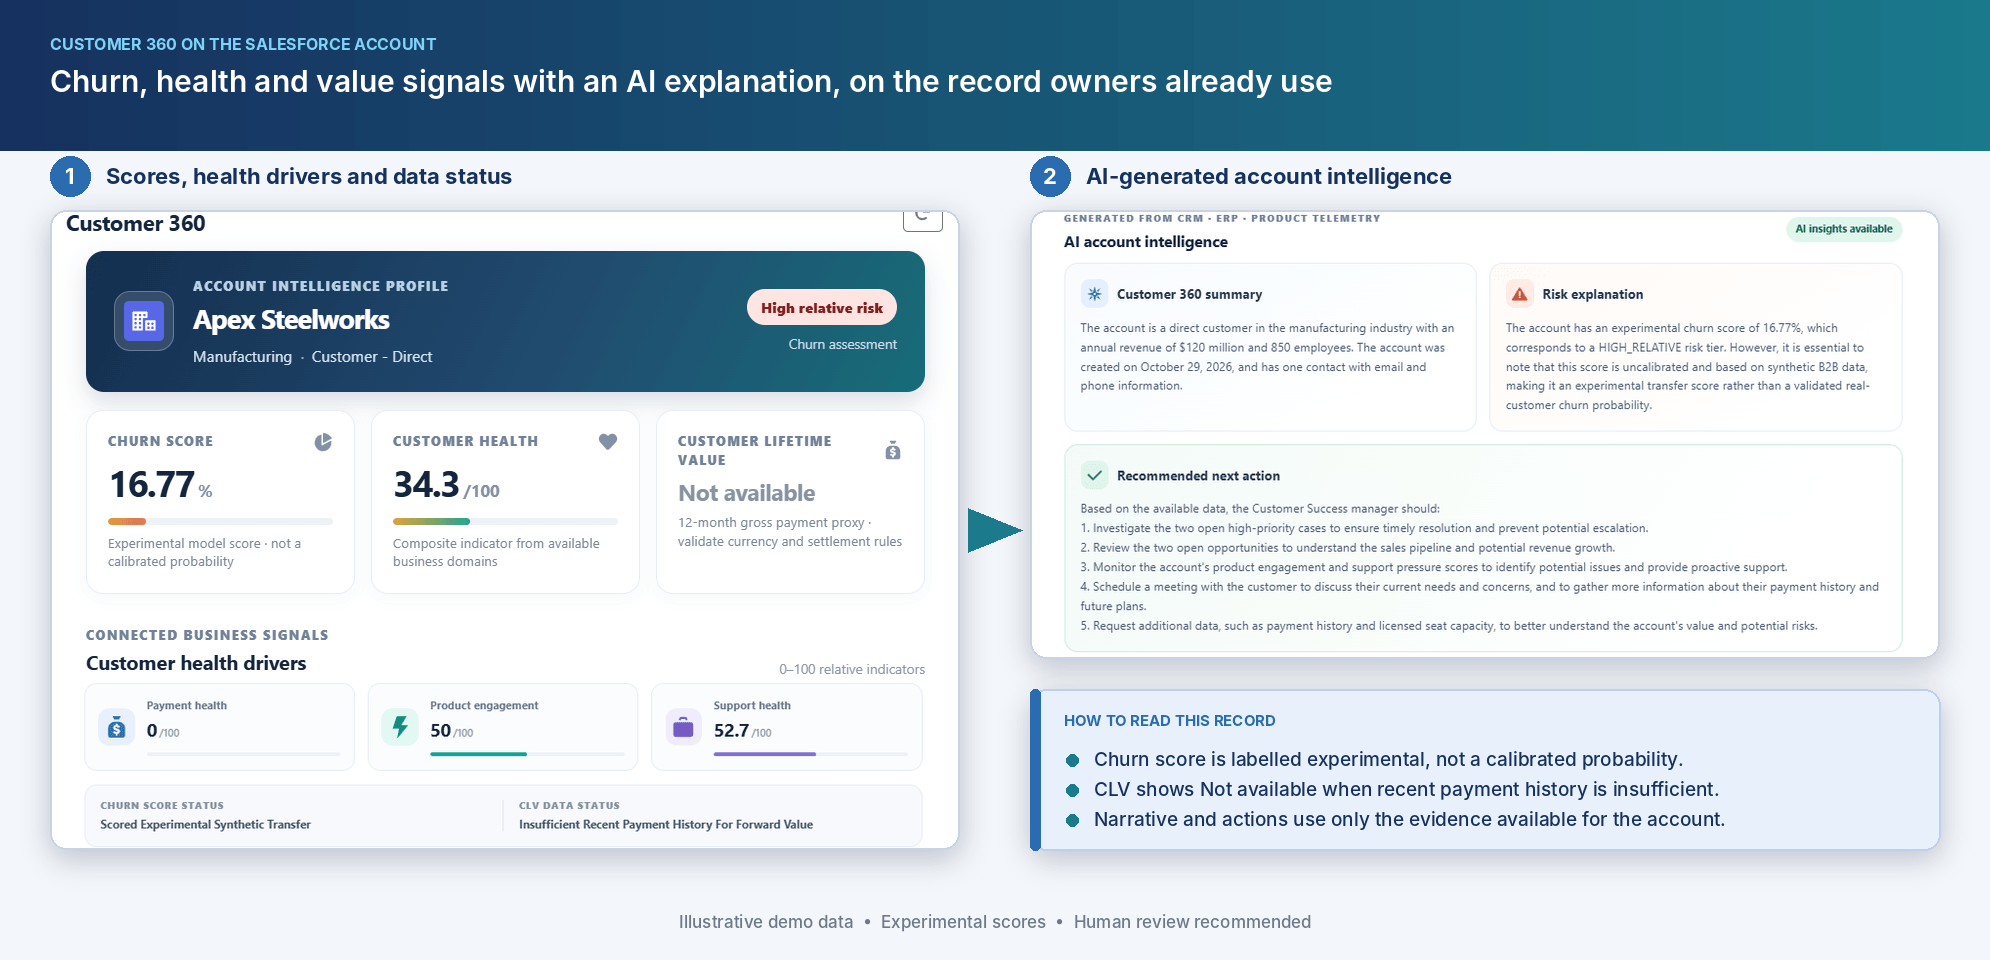
The forward value is calculated only when recent 90-day payment amount and count are both present and positive. That is why Apex Steelworks shows no CLV figure.
Customer health indicators
- Payment health: payment activity and invoice collection.
- Product engagement: relative percentiles for events, sessions and active users.
- Support health: the inverse of open, escalated, high-priority and SLA-pressure cases.
- Composite health score: published only when at least two domains are available. An unlinked source is never treated as healthy or inactive.
A proxy is not revenue
Missing is not zero
Gold payment totals are not yet confirmed as settled cash, and the calculation ignores margin, discounting, retention probability and reversals. Treat it as an exploratory payment-value indicator until Finance validates currency and source semantics.
10. Step 6: Let Llama explain the account
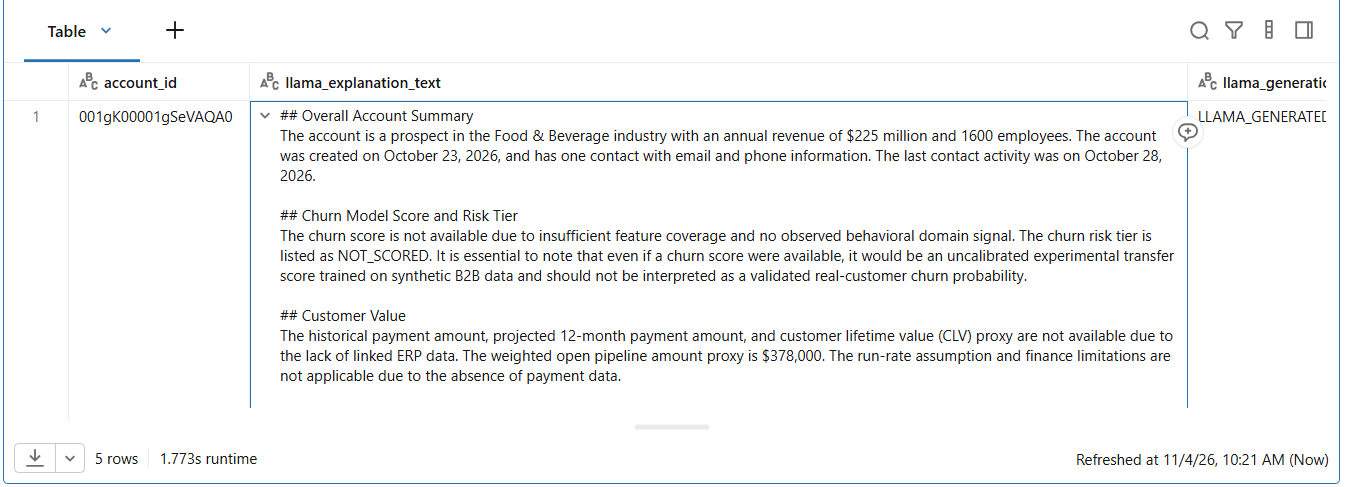
A number does not tell a Customer Success manager what to do. So for each account we assemble an evidence summary and call the Databricks ai_query function with the Meta Llama 3.3 70B Instruct endpoint. The prompt tells the model to use only the supplied evidence, never invent missing values and never turn unavailable data into zero. The response is plain readable text, not JSON.
| Section | What the business user receives |
|---|---|
| Overall account summary | A concise description of the account and available context |
| Churn score and risk tier | Experimental status, relative tier and an explicit limitation |
| Customer value | Historical amount, run-rate assumption, projected value and caveat |
| CRM / ERP / Telemetry / Support | Evidence from each domain, with missing sources named |
| Data gaps and limitations | Unavailable fields, proxies and conflicting signals |
| Recommended actions | Practical follow-ups grounded in the evidence |
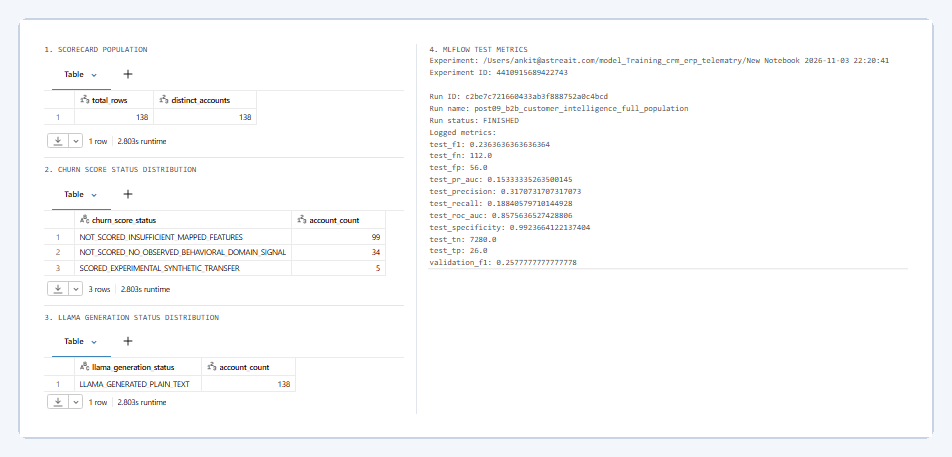
In the latest verified run, all 138 accounts returned a Llama plain-text response with no row-level errors. Generation status is stored separately, so fallback text is never shown as a successful AI explanation. The narrative is commentary on the evidence, not SHAP attribution.
11. Step 7: Bring it back to Salesforce
The final step is the one that changes behaviour. Databricks updates existing Account records through the Salesforce REST API using OAuth. Null values are excluded from payloads so existing Salesforce data is never overwritten, and every update is validated against the target org before writeback is called complete.
| Field group | Fields created on Account |
|---|---|
| Prediction and status | Churn Score (%), Churn Risk Tier, Churn Score Status |
| Customer health | Customer Health, Payment Health, Product Engagement and Support Health scores |
| Customer value | Customer Lifetime Value Proxy, CLV Data Status |
| AI narrative | AI Customer 360 Summary, AI Risk Explanation, AI Next Action Recommendation |
12. What we found
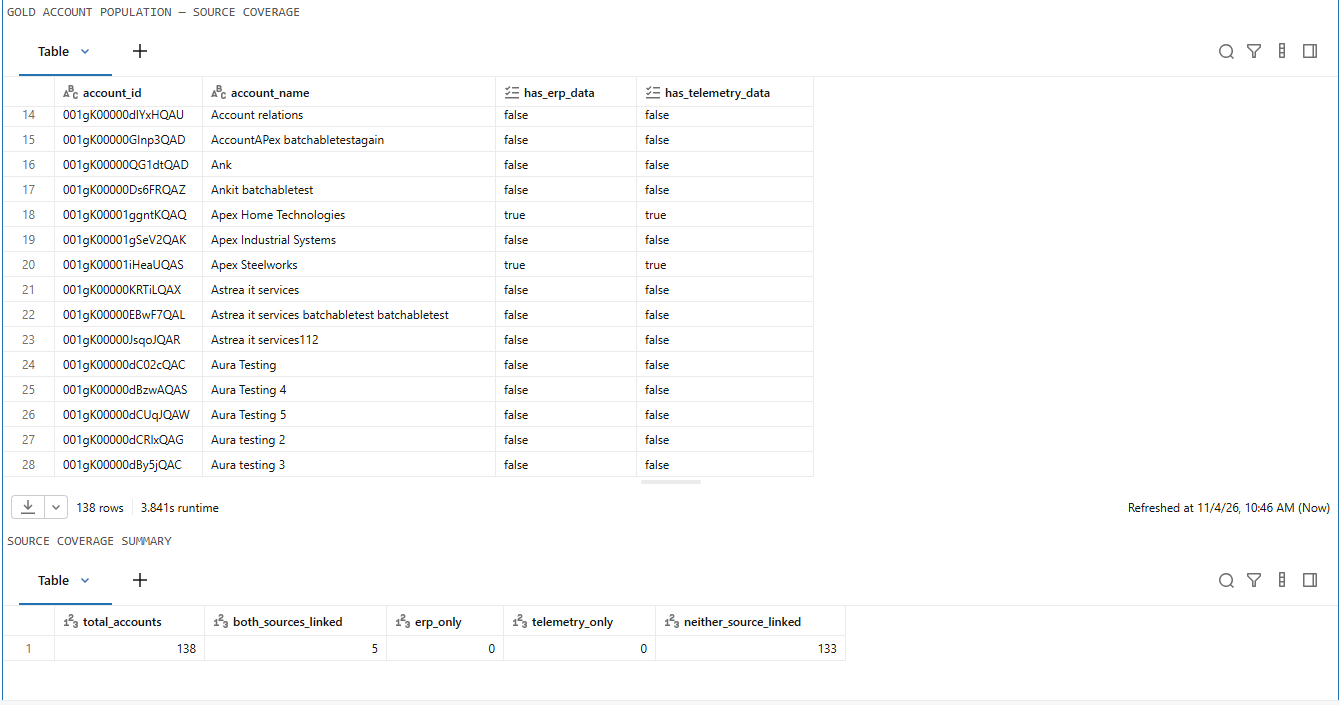
The scorecard covers all 138 Account records. Churn scores appear only when an account has at least two observed mapped model features and an observed behavioural signal. Scores built from imputed inputs are kept for audit but never shown as operational estimates.
| Source coverage | Accounts | Share |
|---|---|---|
| Both ERP and telemetry linked | 5 | 3.62% |
| ERP only | 0 | 0.00% |
| Telemetry only | 0 | 0.00% |
| Neither source linked | 133 | 96.38% |
| Total | 138 | 100% |
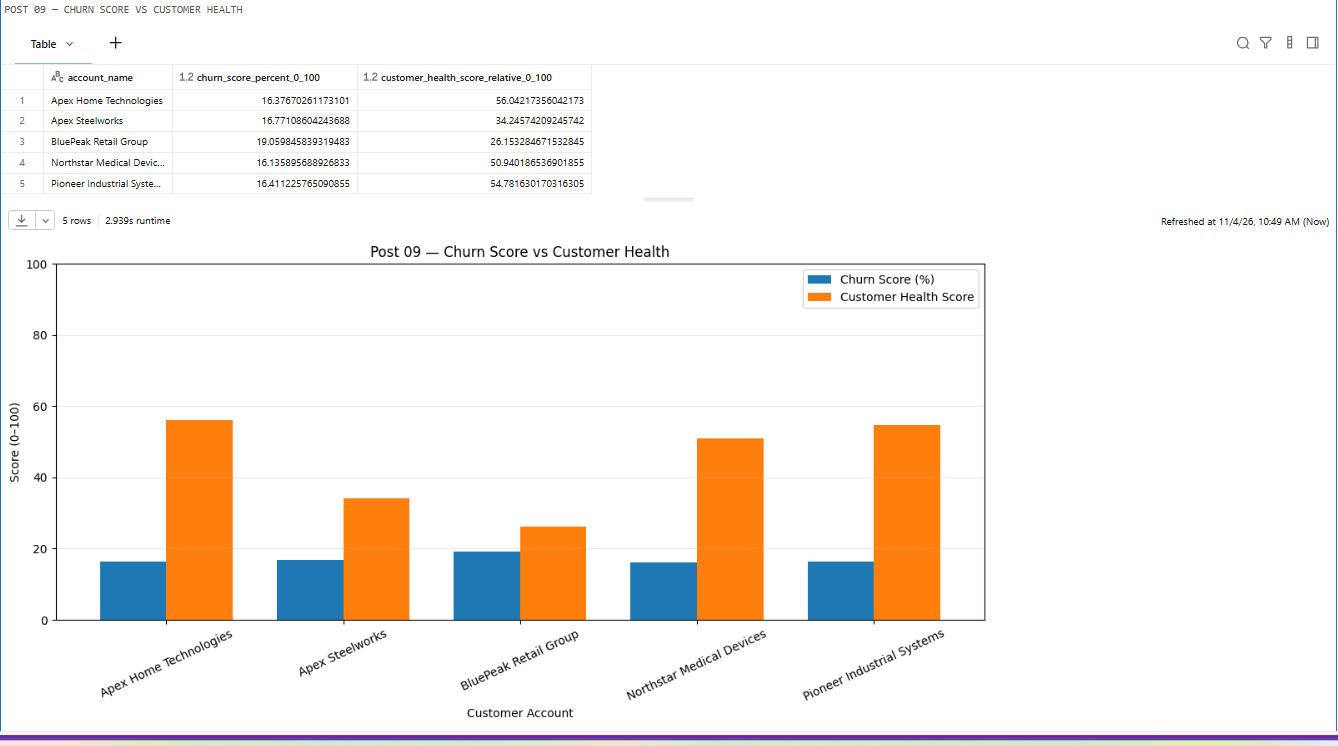
That single table is the most important result in the project. The model works, but linkage is the bottleneck. Five accounts currently qualify for a score:
| Account | Churn score | Relative tier | Health | CLV proxy |
|---|---|---|---|---|
| Apex Home Technologies | 16.38% | Medium | 56.04 | 221,929.50 |
| Apex Steelworks | 16.77% | High | 34.25 | Unavailable |
| BluePeak Retail Group | 19.06% | High | 26.15 | 19,630.32 |
| Northstar Medical Devices | 16.14% | Low | 50.94 | 17,631.50 |
| Pioneer Industrial Systems | 16.41% | Medium | 54.78 | 195,554.25 |
13. What we are being careful about
| Area | Why it matters | Next check |
|---|---|---|
| Synthetic labels | The model may learn patterns that do not transfer to real churn. | Validate with historical B2B churn labels and a temporal holdout. |
| Source coverage | Only 5 of 138 accounts have both ERP and telemetry links. | Fix account-to-ERP and account-to-tenant keys. |
| Feature proxies | Payment ÷ 3 and active-user ratios are not MRR or licensed seats. | Replace with verified source fields. |
| Payment semantics | Totals are not confirmed as cleared cash. | Validate status, reversals and currency with Finance. |
| AI narrative | LLMs can still misstate or omit nuance. | Keep evidence, generation status and human review. |
| Salesforce update | Field-level security, picklists and validation rules can reject updates. | Check field metadata, permissions and per-record outcomes. |
14. What comes next
Current validation results showing scorecard population, churn scoring distribution, LLM generation status, and model evaluation metrics.
- Expand and reconcile ERP customer and tenant links beyond the covered accounts.
- Confirm payment status, currency and reversal rules with Finance.
- Collect real historical churn outcomes and build a validation baseline.
- Capture action outcomes so future versions can measure whether interventions improve renewals, engagement or payments.
Next steps with Astrea IT
Customer teams do not need more reports. They need the evidence from CRM, finance and product usage in one place, a clear explanation of the risk and a sensible next action. By combining Salesforce with ERP and product telemetry in the Databricks Lakehouse, retention decisions become earlier, traceable and easier to review.
At Astrea IT Services, we bring Salesforce CRM data and Databricks Lakehouse capabilities together to build evidence-led analytics and AI solutions that fit your business.
Looking to understand your customers before they leave? Connect with our engineering team to explore a Customer Intelligence solution tailored to your data sources, accounts and governance needs.
If you are interested in more Databricks solutions, visit our Databricks page or Contact Us.