Google Analytics is a free Web Analytics service that provides statistics and basic analytics tools for search engine optimization[SEO] and marketing purposes. The Dimensions and Metrics of Google Analytics are the building blocks of GA reports.
Dimensions are the attributes of your data, such as the city where traffic is coming from, the page you’re measuring, or the social media channel you’re evaluating.
Marketing teams often combine insights from Google Analytics and Google Ads campaigns to understand the full performance of their digital marketing strategies. While Google Analytics focuses on website traffic and user behavior, Google Ads dashboards provide insights into advertising performance such as impressions, clicks, and cost per conversion. Tableau enables organizations to visualize both datasets in powerful interactive dashboards.
Metrics are the quantitative measurements for those dimensions. For example, if you’re looking at how your ads are performing in Paris[dimension], the 3000 paid sessions you’ve recorded would be your matric.
Google Analytics categorizes data into three different levels:
- Acquisition
- Behavior
- Conversions
Tableau software is one of the fastest growing data visualization tool which is currently being used in the BI industry. It is the best way to change or transform the raw set of data into an easily understandable format with zero coding knowledge.
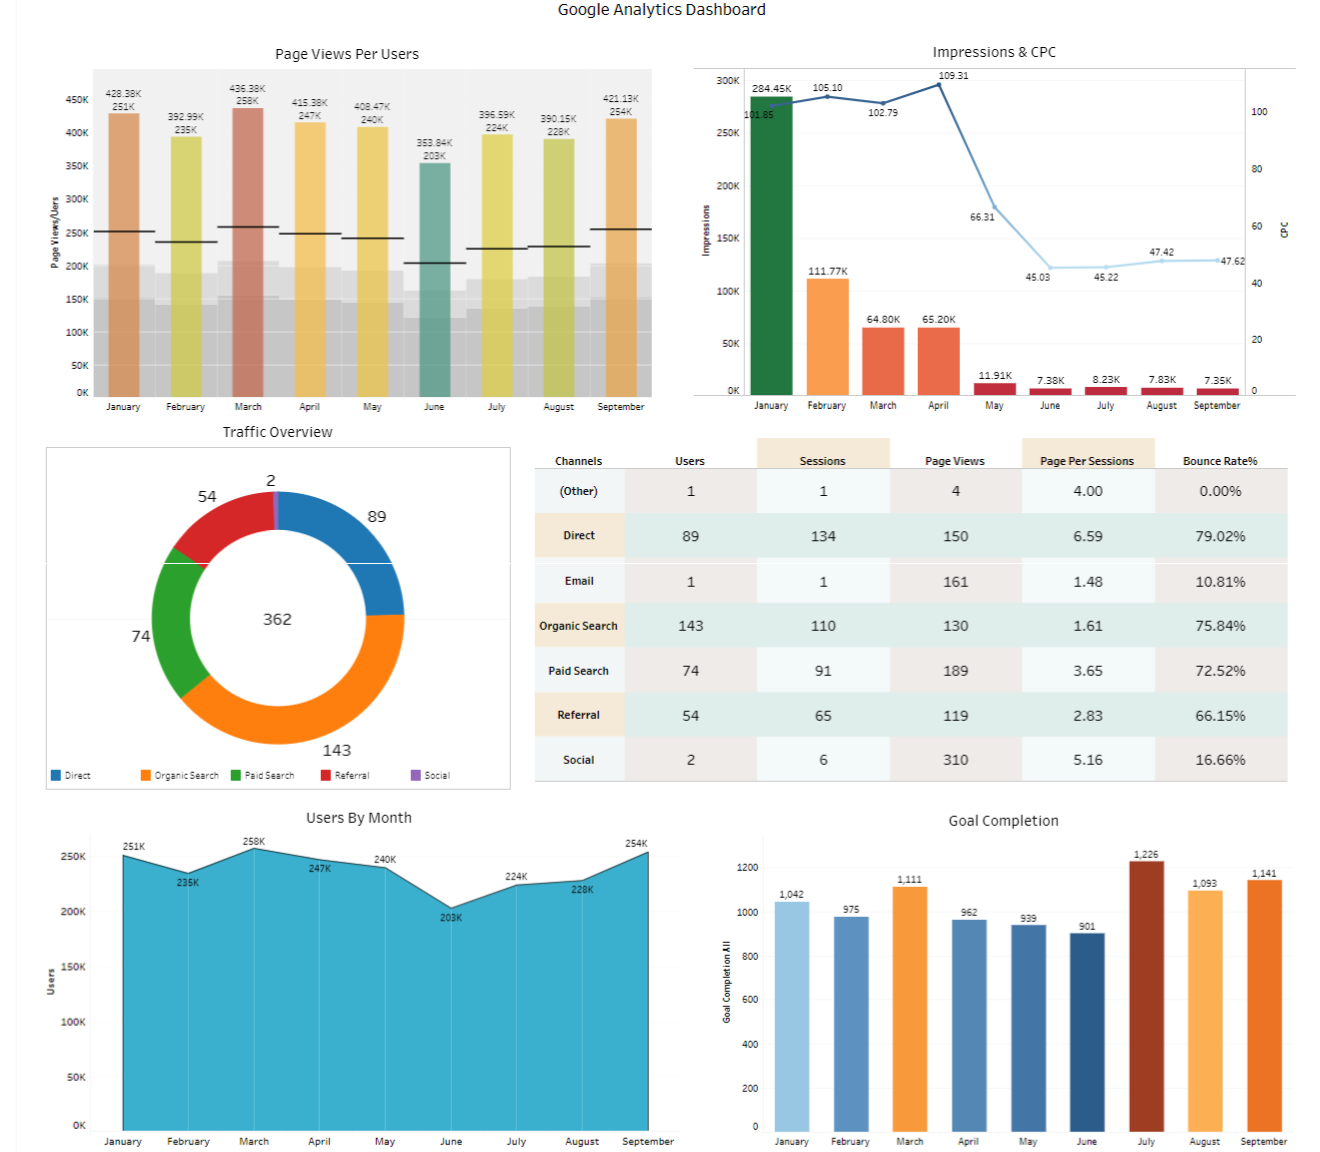
Astrea has extensive expertise in building Google Analytics charts in Tableau. Following are a few examples of charts on the Tableau dashboard for Google Analytics:
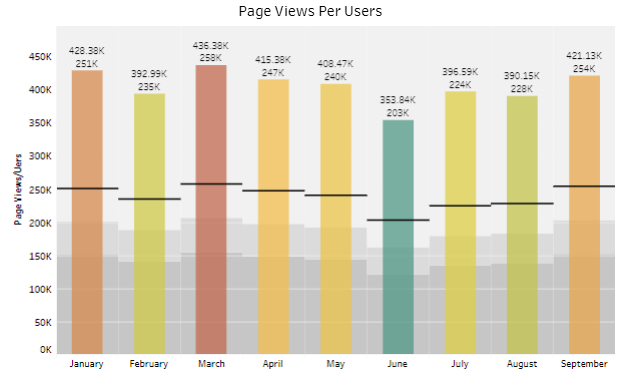
- Page Views Per Users: The Bullet Graph shows the page views per user by month. A bullet graph is useful for comparing the performance of a primary measure to one or more other measures.
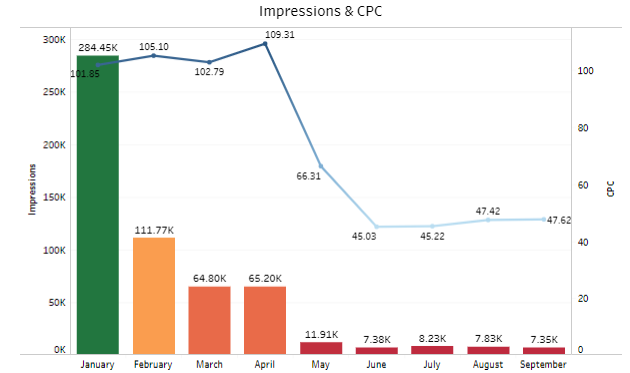
- Impressions & CPC: The Horizontal Bar Chart and Line Chart show the total impressions and CPC by month. In this chart, the feature of the dual-axis is shown. Dual-Axis in Tableau is used for comparing two different data at a time.
-
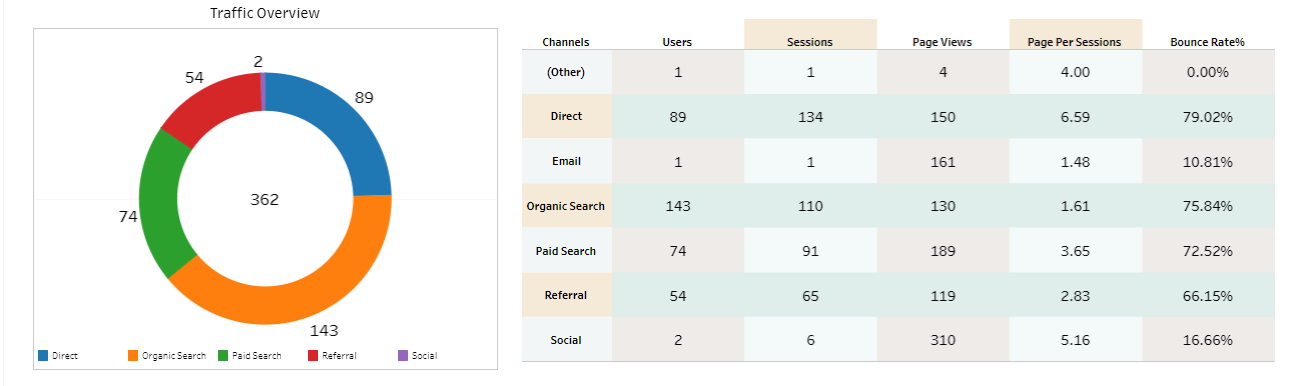
Traffic Overview: We have used two widgets, Donut and Text Table to show the information related to the Traffic. Donut Chart shows the Channels through which traffic is coming to our site. There are mainly five sources of traffic which are given below:
- Direct Search
- Organic Search
- Referral Search
- Social Search
- Paid Search
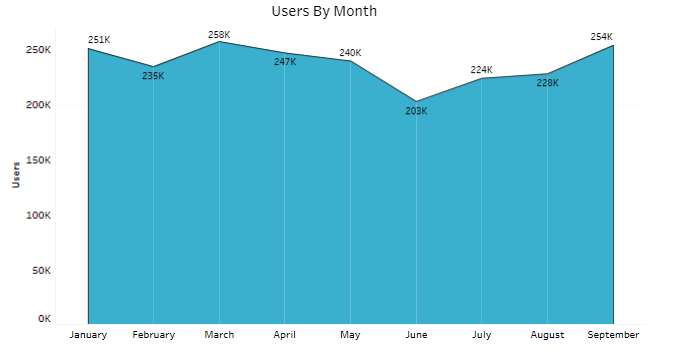
- Users By Month:The Area Chart shows the total number of users by dates month-wise.
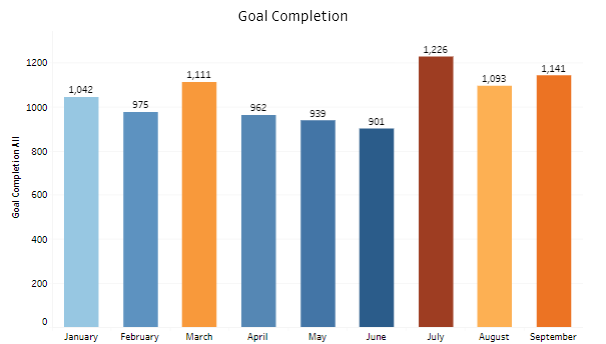
- Goal Completion: The Horizontal Bar Chart shows the total goal completion by month.
The image shown below is the complete visualization of the GA Dashboard on Tableau. The data of the Dashboard changes according to the filter applied to it.
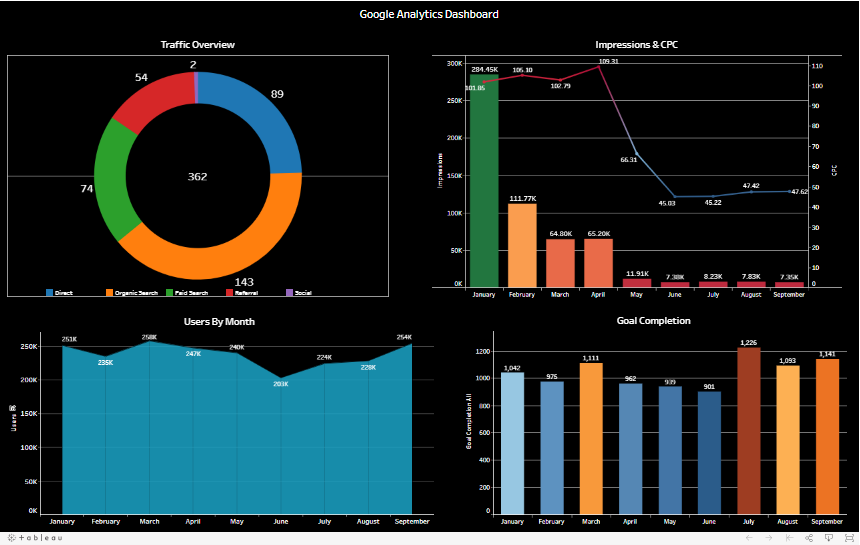
An alternative representation of the Dashboard:
Marketing teams often combine insights from Google Analytics and Google Ads campaigns to understand the full performance of their digital marketing strategies. While Google Analytics focuses on website traffic and user behavior, Google Ads dashboards provide insights into advertising performance such as impressions, clicks, and cost per conversion. Tableau enables organizations to visualize both datasets in powerful interactive dashboards.
Summary:
Interactive dashboards like the Google Analytics dashboard demonstrate how Tableau transforms complex datasets into meaningful insights. Similar dashboards can also be created for Salesforce case management and service analytics. ar dashboards can also be created for Salesforce case management and service analytics. These dashboards help organizations track support performance, identify service bottlenecks, and improve response times.
Tableau continues to play a crucial role in modern business intelligence by helping organizations convert raw data into clear, actionable insights. From marketing analytics and website traffic monitoring to CRM reporting and operational dashboards, Tableau enables data-driven decision making across departments. To explore more Tableau dashboards, analytics solutions, and business intelligence use cases, visit our Tableau Analytics Expertise Page.
Resources:
- https://help.tableau.com/current/pro/desktop/en-us/examples_googleanalytics.htm
- https://ga-dev-tools.appspot.com/dimensions-metrics-explorer/
- https://www.tableau.com/solutions/google
- https://www.tableau.com/learn/whitepapers/maximize-your-marketing-efforts-google-analytics
For any query on Google Analytics Dashboard On Tableau, contact support@astreait.com