Tableau is a visualization tool used in the Business Intelligence Industry. It is used for developing effective and interactive charts for the customers to make their business more understandable and easy. Tableau allows users to create data visualizations in the form of ‘Dashboards’ and ‘Worksheets’.
Google Adwords is a web based platform used by the advertisers for placing online advertisements in the form of Product listing Ads, text ads and banners. It is the largest advertising organisation in the world.
Astrea has developed advanced charts in Tableau on Google Adwords. The article below shows some charts of Tableau on Google Adwords.
Tableau dashboards are widely used to visualize marketing and advertising performance across multiple digital platforms. For example, organizations often combine advertising insights with website analytics to gain a complete view of campaign performance. A Google Analytics Dashboard built on Tableau enables businesses to track website traffic, user engagement, and marketing effectiveness alongside advertising metrics.
Beyond advertising analytics, Tableau is also extensively used for CRM data visualization. Organizations often integrate Salesforce data with Tableau dashboards to monitor sales performance, customer interactions, and campaign outcomes in a single analytics platform. By combining CRM data with marketing metrics like Google Ads performance, businesses gain deeper insights into how advertising efforts influence revenue and customer acquisition.
-
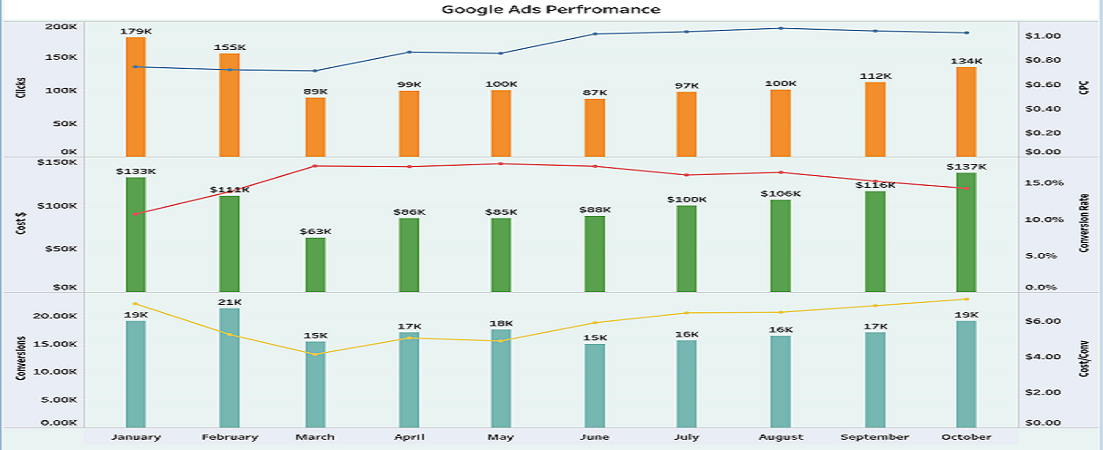
Google Ads Performance: The Bar Chart and the Line Chart show the overall performance of Google Ads. A period selector is also added on the top of the dashboard which on click changes the data of the charts dynamically. The Google Ads performance is shown monthly, weekly and daily as per the selection.
-
In the below viz there are three different divisions showing 3 bars and 3 lines:
- Clicks & CPC(cost per click)
- Cost & Conversion Rate
- Cost per Conversion
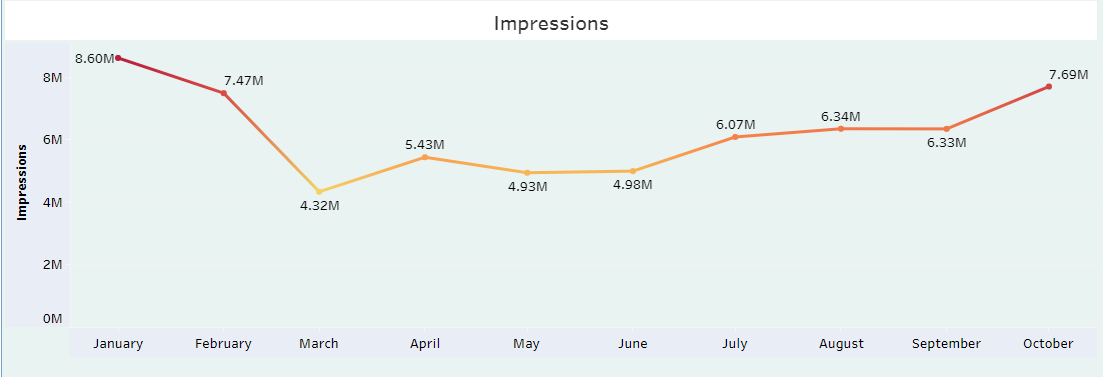
- Impressions: The Line Chart shows the total number of Impressions month-wise. Weekly and daily data can also be seen by selecting the period selector.
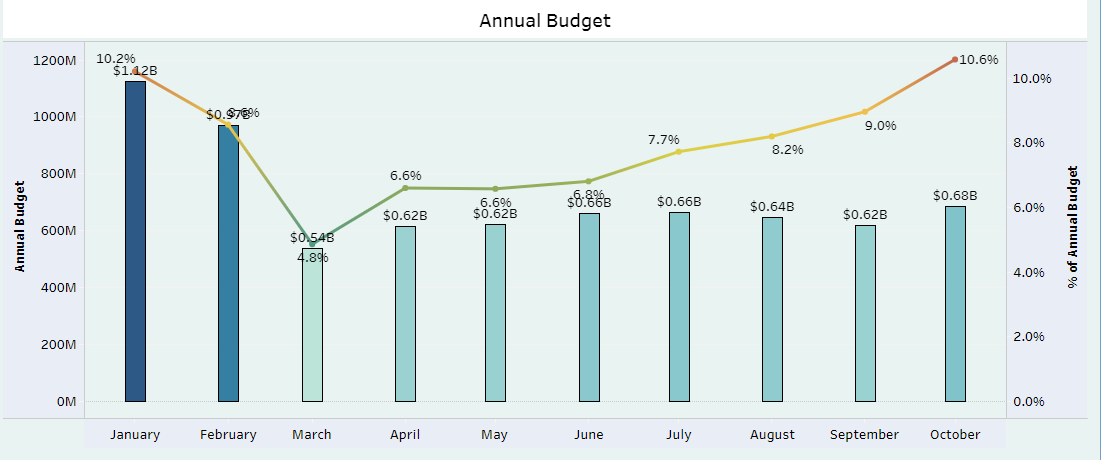
- Annual Budget: The Bar Chart shows the annual budget and the Line Chart shows the total percentage of Annual Budget monthly.
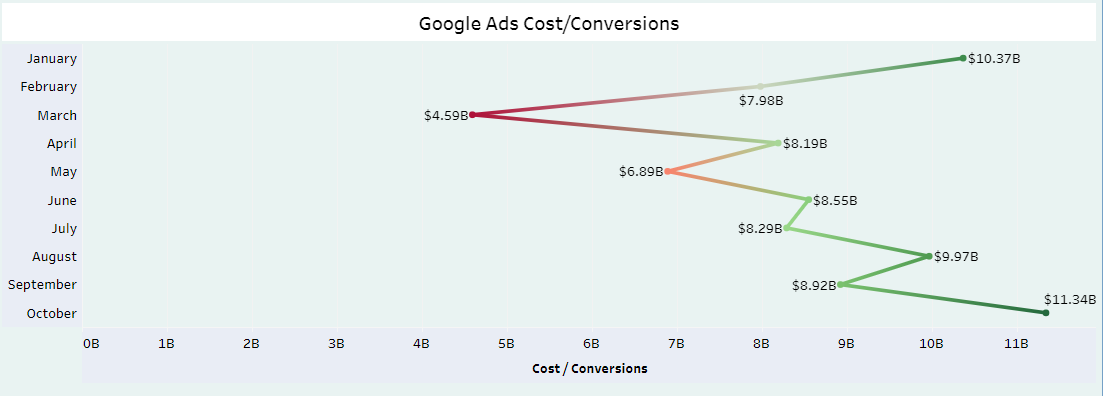
- Google Ads Cost/Conversions: The Line Chart shows the calculation of Cost per Conversion monthly.
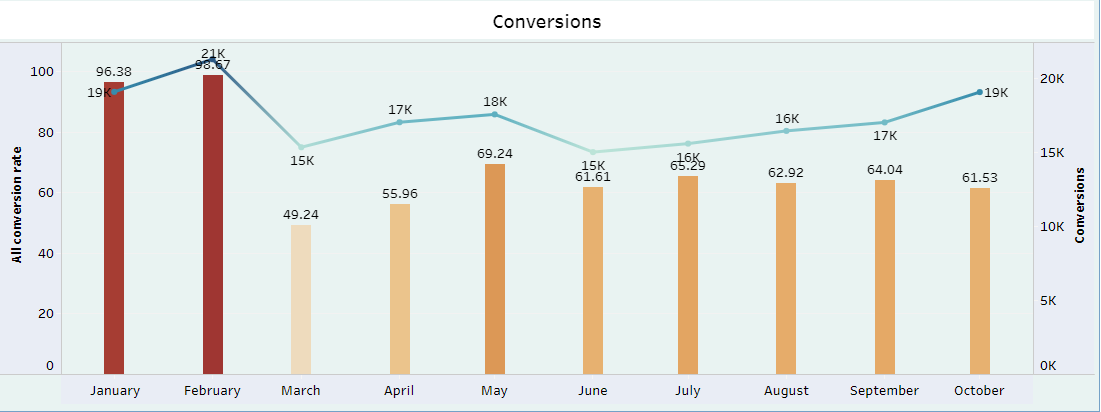
- Conversions: The Bar Chart shows the Conversion Rate and Line Chart shows the total Conversion monthly. Also, weekly and daily conversions can be fetched by changing the period selector.
Below is the whole visualization of the dashboard “Google Ads Dashboard”. All the visualization of the dashboard displays the data according to the Period Selector that filters the data by Monthly, Weekly, and Daily.
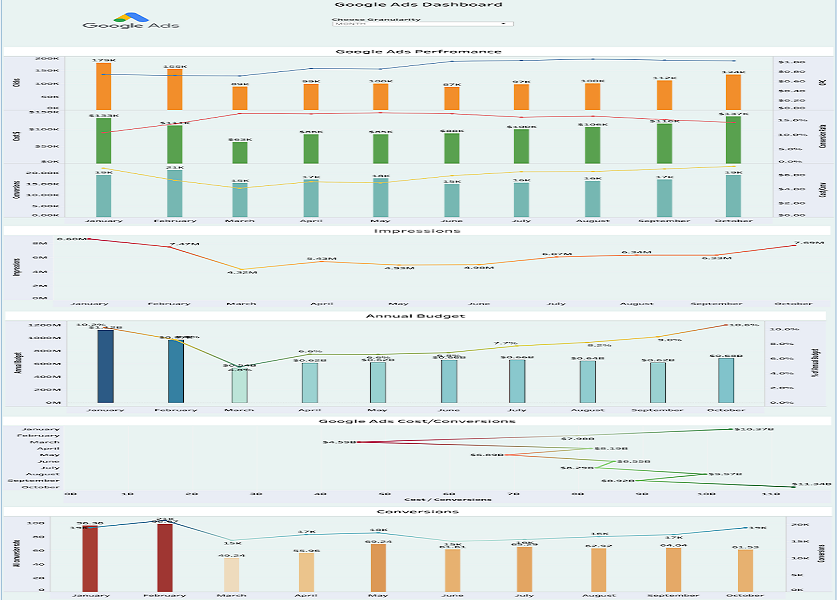
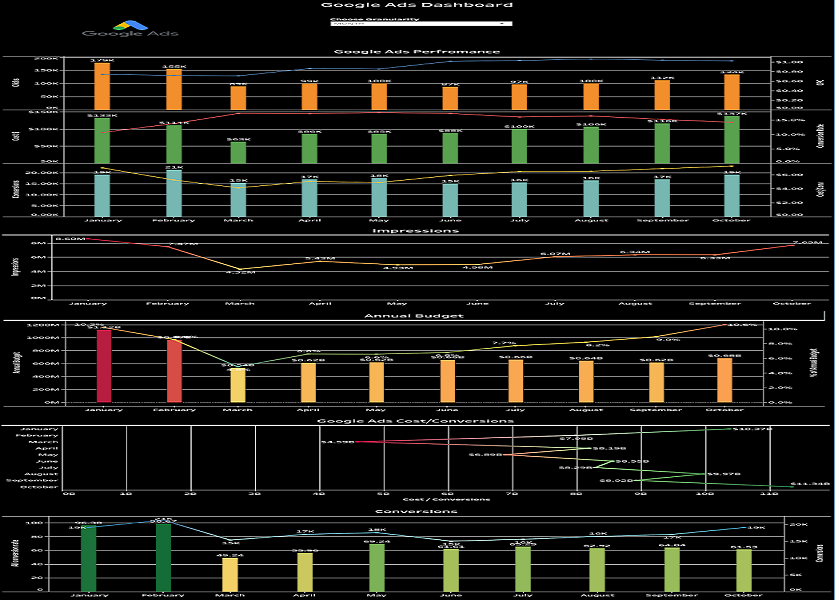
An alternative representation of the Dashboard:
 Resources:
- https://www.tableau.com/about/blog/2019/4/get-started-google-ads-connector-improve-ad-campaign-performance-105153
- https://www.tableau.com/solutions/google
Summary:
In addition to marketing and sales analytics, Tableau dashboards can also help organizations monitor operational data such as customer service performance. Integrating Salesforce case management data with Tableau dashboards enables companies to track support tickets, case resolution times, and service team performance. These dashboards help businesses improve customer satisfaction and operational efficiency by providing clear insights into service operations.
Interactive dashboards like the Google Ads Dashboard demonstrate how powerful Tableau can be in transforming raw marketing data into meaningful insights. From advertising analytics and website traffic monitoring to CRM reporting and customer support analysis, Tableau enables organizations to make data-driven decisions across departments. If you want to explore more advanced Tableau solutions, analytics use cases, and dashboard development strategies, visit our Tableau Analytics Expertise page.
For any query on Google Adwords Dashboard On Tableau, contact support@astreait.com