Salesforce Einstein Analytics(Wave Analytics) is a new cloud based analytic tool that will help you to create powerful reports and dashboards from your large amount of enterprise data. Also Wave Analytics enables anyone to get immediate access to powerful data insights through its point-and-click visual interface of your org. A user could get instant visualizations that show how your business is doing.
We have made some advanced charts in Einstein's Analytics on Salesforce Standard Objects- Opportunity, Account and Case.
While this dashboard focuses on Opportunities, similar analytics techniques can be applied to Leads for understanding early-stage customer engagement and conversion trends. Lead dashboards provide valuable insights into lead sources, status progression, and marketing effectiveness, complementing opportunity analysis.
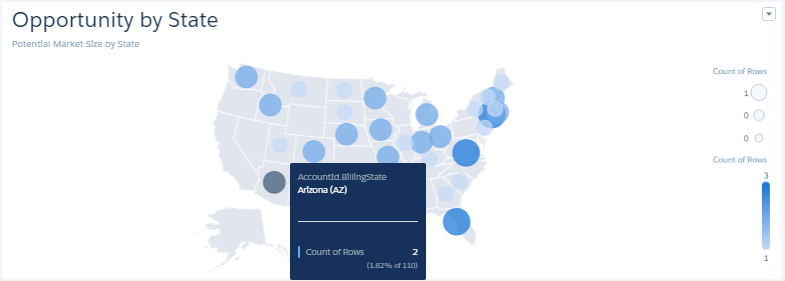
- Opportunity by State : The Bubble Map shown below displays number of Opportunities with respect to State. It gives an output about what is the potential market size by State.
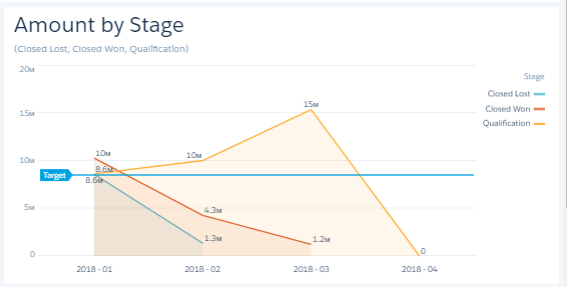
- Amount by Stage : The following Line widget displays sum of amount with respect to stages in object Opportunity. We have applied filters on field stage i.e. Closed Lost, Closed Won and Qualification.
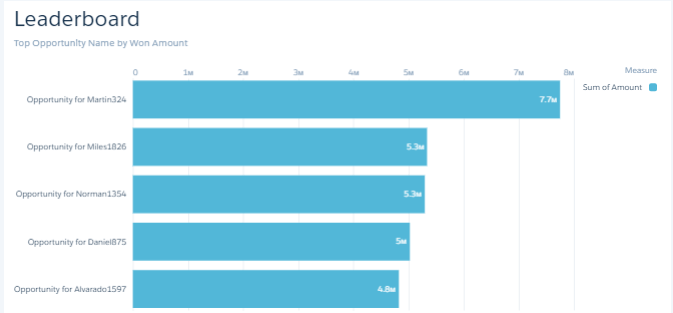
- Leaderboard : The following bar chart displays sum of amount of top 5 Opportunity Owner. Also we have applied filter on field won whether it is true or false. Only those Owner are selected whose won value is equal to true.
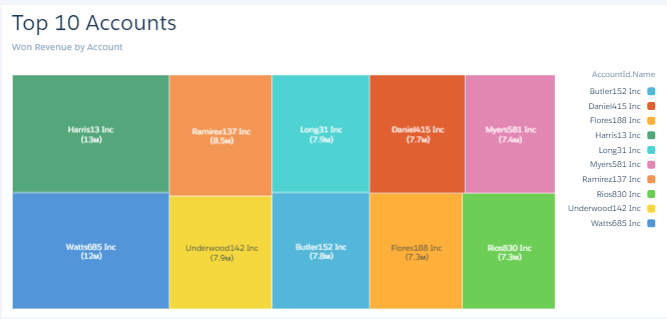
- Top 10 Account : The Tree Map shown below displays Won Revenue of Top 10 Account.
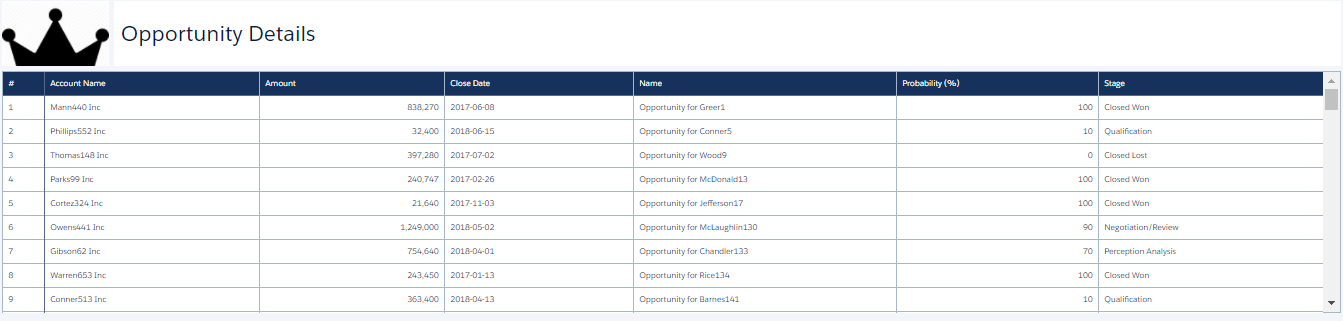
- Opportunity Details : The Value table shown below displays all the Opportunities details and data related to Opportunities i.e. Account Name, Opportunity Owner, Amount, Stage, Probability and Closedate.
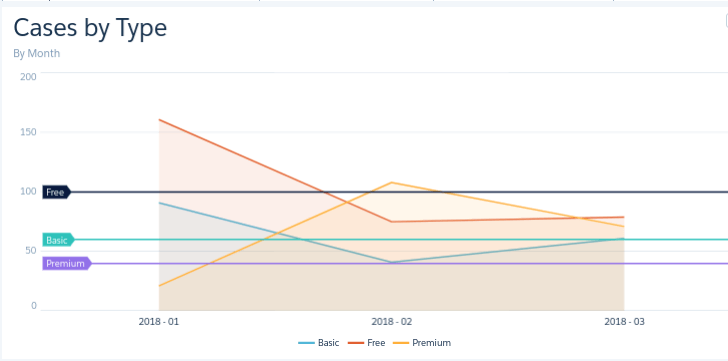
- Case by Types : The following Line widget displays number of cases in a particular month filtered by the types. There are 3 types of cases i.e. Free, Premium and Basic.

CRM Analytics dashboards are not limited to Salesforce data and can be extended to include external data sources such as website analytics. Integrating Google Analytics data allows organizations to analyze user behavior, traffic patterns, and campaign performance alongside CRM data, providing deeper insights into customer journeys.
The effectiveness of opportunity dashboards depends heavily on the quality and completeness of the underlying data. CRM Analytics enables seamless integration between Salesforce and various external systems, ensuring that dashboards reflect a unified and accurate view of business performance. This integration is essential for building scalable and insightful analytics solutions. To explore more about integration capabilities, refer to our article CRM Analytics Salesforce Integration page.
For any query on Salesforce Opportunity Dashboard on Einstein's Analytics, contact support@astreait.com