1. Modern Support Challenge: The Cost of Switching Between Systems
Many enterprise support teams face a common problem: the information needed to resolve customer issues is spread across different systems.
For example, in a typical B2B organization:
- Support Tickets: Customer issues and their priorities are recorded in Salesforce Service Cloud or Zendesk.
- Technical Data: API logs, error messages, and device health information are stored in platforms such as Databricks, Snowflake, or Kafka.
- Warranty and Returns: Product replacements, warranty claims, and billing records are managed in systems such as SAP or NetSuite.
- Customer Revenue: Contract values, annual recurring revenue (ARR), and renewal dates are tracked in Salesforce
Sales Cloud.
When investigating a high-priority case, support engineers often need to switch between these systems, search for relevant information, and manually connect the details. This takes time, delays issue resolution, increases the workload on engineering teams, and may put customer renewals at risk.
Another challenge is that traditional support is mostly reactive. Devices may start failing because of a faulty update or a technical issue before customers report a problem. Without a way to connect information across systems, teams may discover these issues only after customers are affected.
To address these challenges, organizations need more than a chatbot that answers questions. They need an AI support agent connected to the enterprise lakehouse that can combine data from different systems, prioritize cases based on technical and business risks, find relevant troubleshooting guides, and perform approved actions directly in Salesforce.
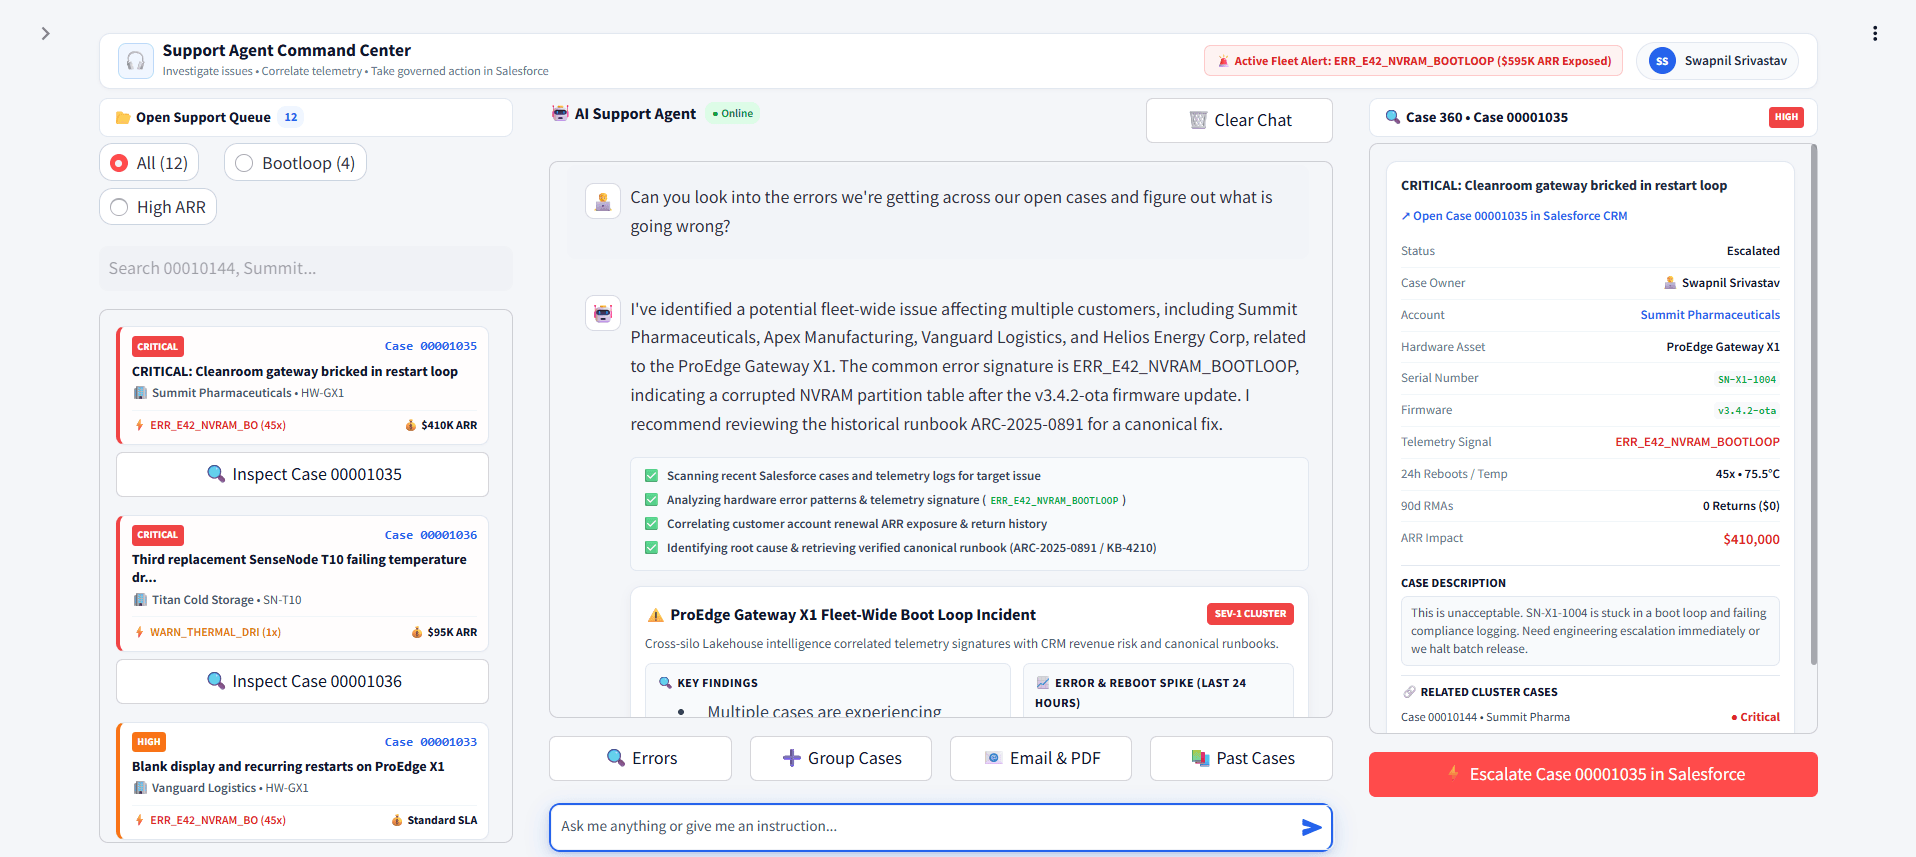
2. Proof of Concept: Support for a Fleet of Connected Devices
To demonstrate how an autonomous support agent can work, we built this POC around a company that manages IoT gateway devices and industrial temperature sensors. The scenario combines device monitoring, hardware warranty claims, and business contracts.
The support team works with four main types of data:
- Hardware and Devices: Gateway devices (ProEdge Gateway X1/X2) and industrial temperature sensors (SenseNode T10) used across manufacturing, pharmaceutical, cold-storage, and energy facilities.
- Device Telemetry: Information such as CPU temperatures, frequent reboots, device status, and critical error logs.
- Warranty and Returns: Records of hardware replacements, refunds, and repeated warranty claims.
- Salesforce CRM Data: Customer support cases, contract values, and upcoming renewal dates.
We designed the POC to handle four common support challenges:
- Large-Scale Firmware Failures: A faulty firmware update causes multiple gateway devices to enter continuous reboot loops.
- Undetected Device Failures: Devices repeatedly crash, but customers have not yet reported the problem.
- Repeated Hardware Issues: Devices in cold-storage environments experience recurring failures, leading to repeated warranty claims and putting important customer renewals at risk.
- Delayed Case Resolution: High-priority support cases remain unattended for days because engineering teams are overloaded.
This approach can also be adapted to other industries, including cloud software, e-commerce, and digital banking.
NOTE : This proof of concept currently uses representative operational data and simulated device-failure scenarios to demonstrate how Databricks and Salesforce can work together. The results illustrate the proposed workflow and should not be interpreted as production performance measurements.
3. The Technical Journey: Engineering the Autonomous Lakehouse Agent
Building an AI agent that can investigate issues and take action requires a few clear steps. We organized the work into four main stages: preparing the data, connecting tools, registering the model, and deploying an interactive application.
Stage 1: Building the Unified Cross-Silo Data Foundation
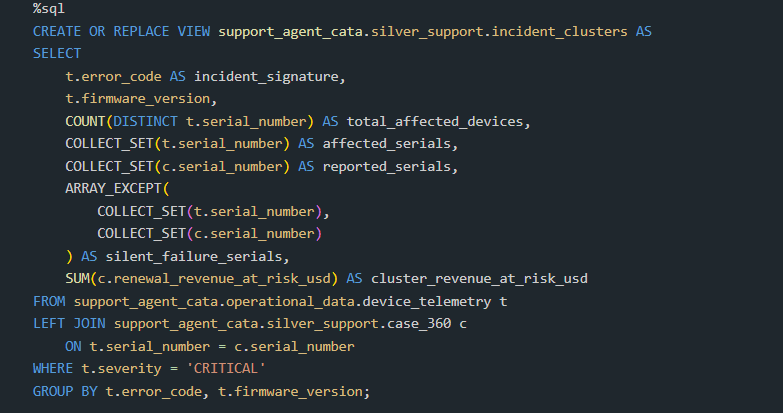
In the first data engineering phase (Notebook 01: 01_silver_intelligence_layer), we created the data foundation in Databricks Unity Catalog under the support_agent_cata catalog across the operational_data and silver_support schemas. Instead of asking the LLM to join large raw tables every time it answers a question, we prepared three Silver views in advance:
- silver_support.case_360: Joins Salesforce Cases, Accounts, and Opportunities with device crash logs and ERP hardware return records. For each open case, it brings together the latest error details, reboot counts over 24 hours, operating temperatures, 90-day RMA totals, and ARR at risk from upcoming renewals.
- silver_support.incident_clusters: Groups critical error patterns across firmware versions. It compares devices that are crashing with devices that have reported cases, helping identify failures that customers have not reported yet.
- silver_support.case_risk_triage: Ranks cases using an escalation_risk_score from 0 to 100 instead of relying only on first-in, first-out order. The score considers telemetry severity, repeat hardware returns, and how close a contract is to renewal.
Stage 2: Equipping the Agent with Semantic RAG and an Enterprise Action Registry
With the data foundation in place, the second phase (Notebook 02: 02_agent_tools_and_retrieval) focused on helping the agent find relevant past cases and safely run approved actions.
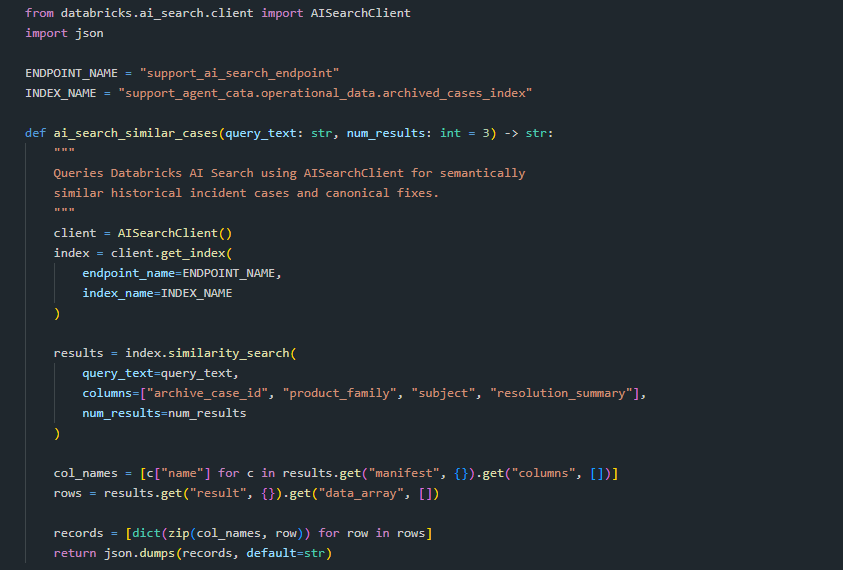
First, we reduced the risk of incorrect engineering advice by enabling Change Data Feed on operational_data.archived_cases and creating a Databricks Vector Search Delta Sync Index using the databricks-bge-large-en embedding model. The agent can search past incident reviews and retrieve fixes that engineering has already verified.
Next, we separated tools that only read information from tools that change records or trigger actions:
- Read and Investigation Tools: Query Lakehouse views through a Databricks SQL Warehouse without changing data (get_queue_triage, investigate_case, get_incident_cluster, ai_search_similar_cases).
- Governed Action Tools: Make authenticated, approved changes through enterprise APIs (sf_create_parent_incident, generate_incident_brief_pdf, sf_attach_file_to_case, send_sf_html_escalation_email, sf_escalate_case).
Stage 3: Packaging, Registering, and Governing the Agent with MLflow & Unity Catalog
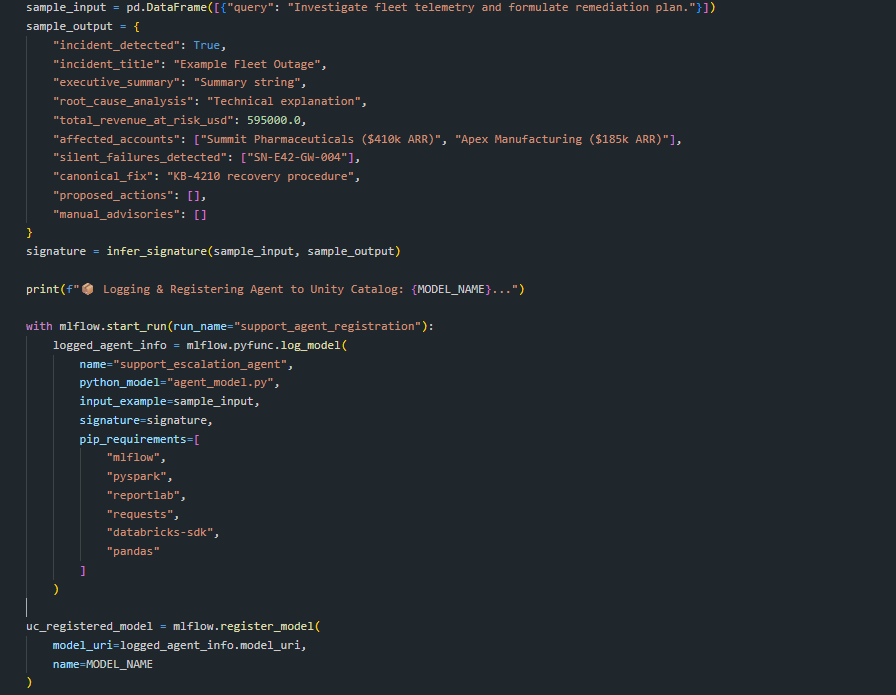
In the third phase (Notebook 03: 03_support_escalation_agent), we brought the tools, agent instructions, and safety checks together in an MLflow model artifact.
We built a conversational ReAct (Reasoning + Acting) workflow powered by Meta Llama 3.3 70B Instruct (databricks-meta-llama-3-3-70b-instruct). The instructions guide the model's tool choices and the required structured JSON outputs.
We packaged the agent as a custom mlflow.pyfunc.log_model in agent_model.py, including its input/output schemas, dependencies, and supporting files. We logged the agent with an inferred signature, explicit runtime dependencies, and an input example, and registered it directly into Unity Catalog as `support_agent_cata.silver_support.support_escalation_agent`. This provides a governed model artifact and a foundation for model lineage, version management, and controlled deployment across environments.
Stage 4: Operationalizing the Unified Command Center (The Databricks App)
To move beyond notebook testing, we deployed the system as a Databricks App, with the interface in app.py and the agent's execution logic, which we prototyped and tested in the notebooks, in agent_tools.py.
The app provides a command center where support leads can review cases and stay involved in important decisions:
- Prioritized Queue: Lists support cases by escalation risk and ARR exposure, with priority labels and quick filters.
- Case 360 Inspector: Shows the selected case's diagnostic details, including device serial numbers, temperatures, 24-hour reboot counts, 90-day RMA history, contract renewal values, and related incidents. It also provides a one-click option to escalate the case in Salesforce.
- Conversational Workspace: Lets support leads chat with the registered AI agent. Session memory keeps the investigation context between messages, while the app displays relevant result cards and progress indicators.
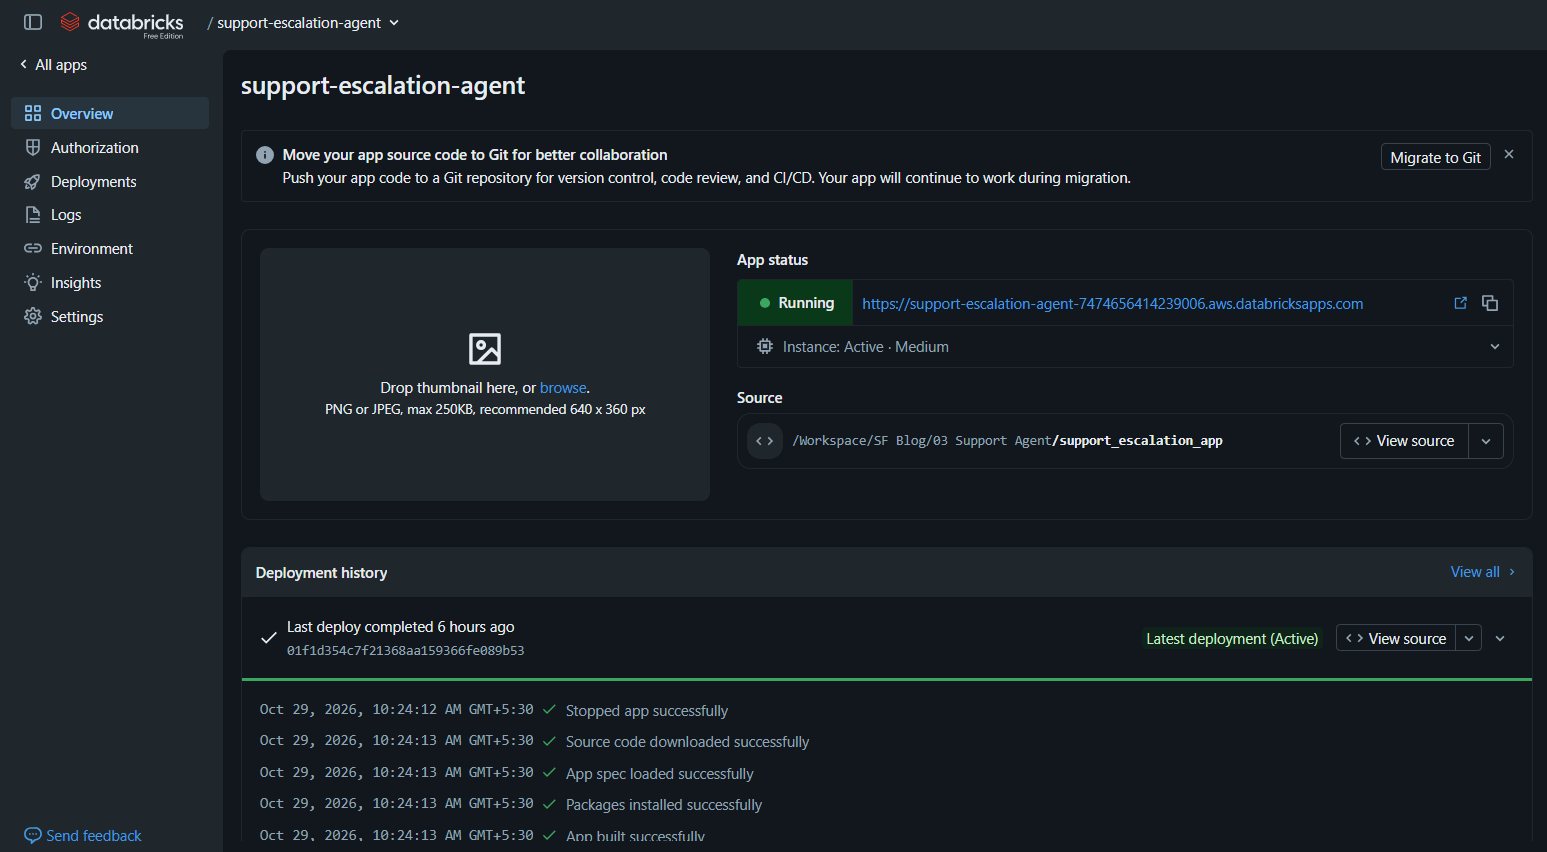
4. Core Capabilities: How the Autonomous Agent Transforms Support Operations
We tested the agent across several support scenarios, including finding likely causes, taking approved actions, retrieving past fixes, identifying renewal risks, and avoiding unnecessary escalations.
4.1. Automated Outage Clustering & Silent Failure Detection
During a widespread device outage, support teams need to quickly identify common patterns across customer cases rather than investigate each issue separately. Connecting device telemetry with Salesforce case data helps the agent identify shared problems and detect failures that customers may not have reported yet.
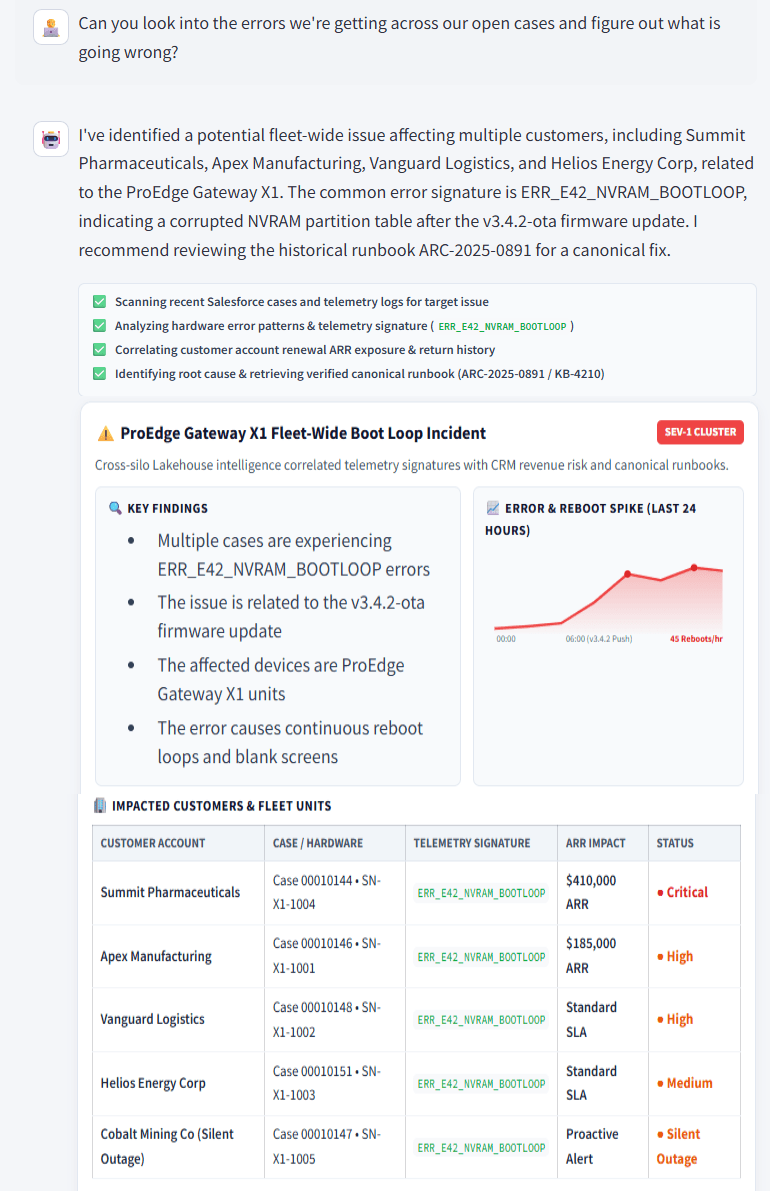
As shown above, the agent connects related cases to a common firmware issue, identifies a device experiencing repeated crashes without an open support case, estimates the revenue at risk, and provides relevant recovery steps from the verified engineering runbook.
4.2. Targeted Case Grouping & Automated Parent Incident Creation
When an outage affects multiple customers, related support cases need to be grouped under a single parent incident. This helps support and engineering teams coordinate troubleshooting, fixes, and customer communication.
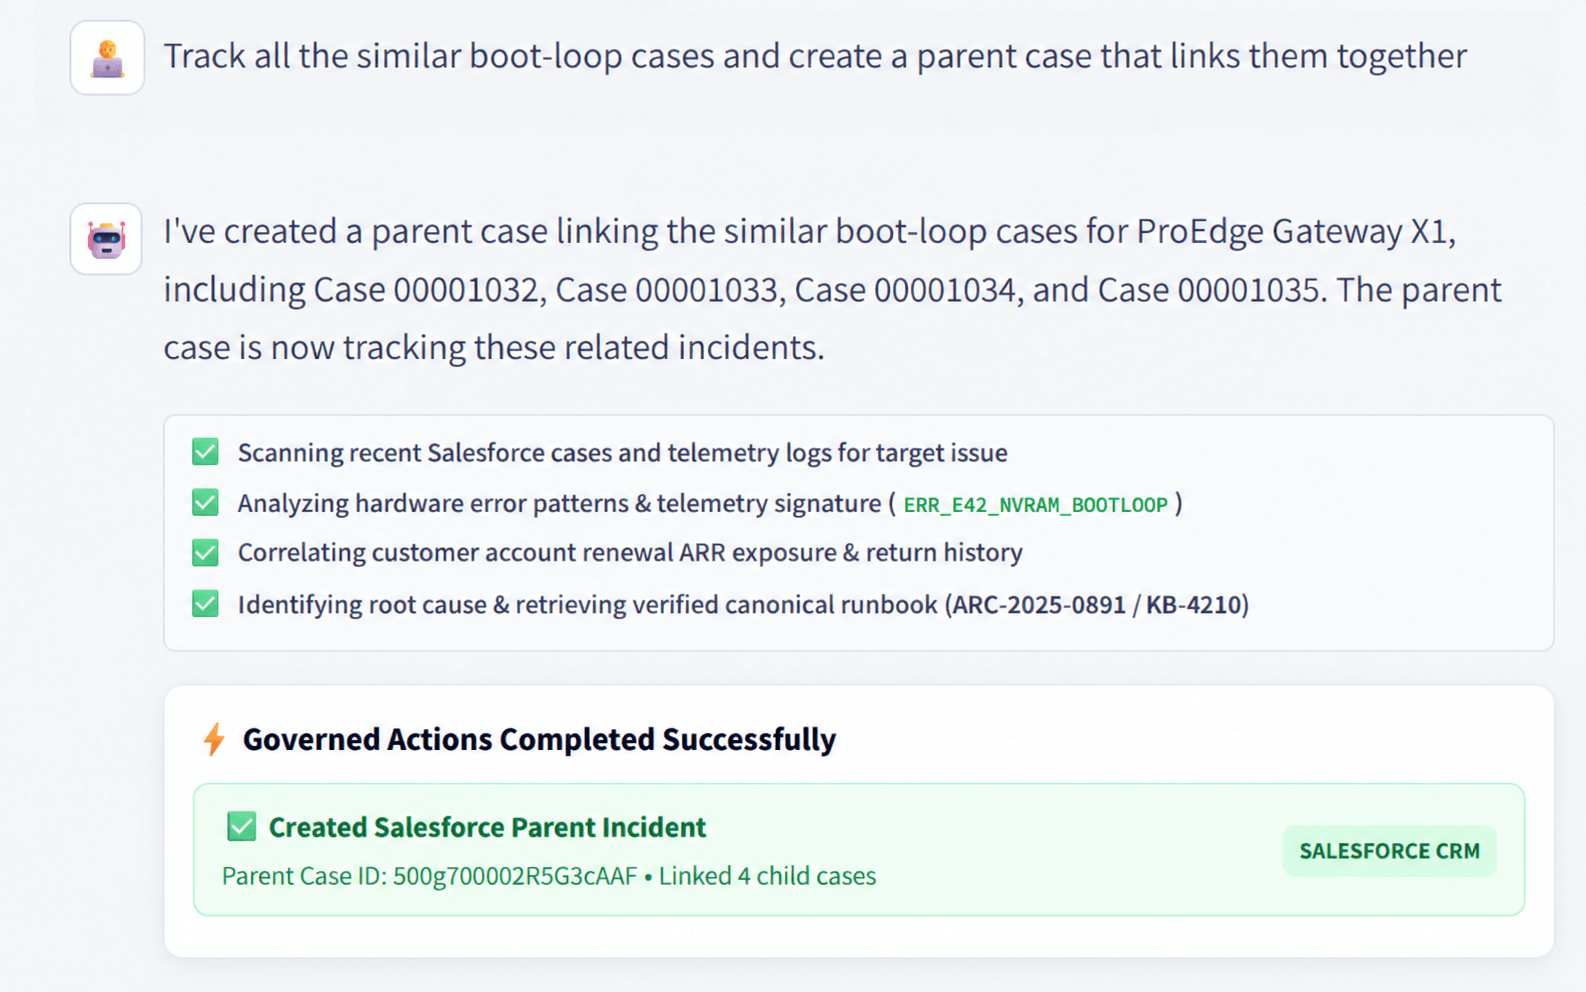
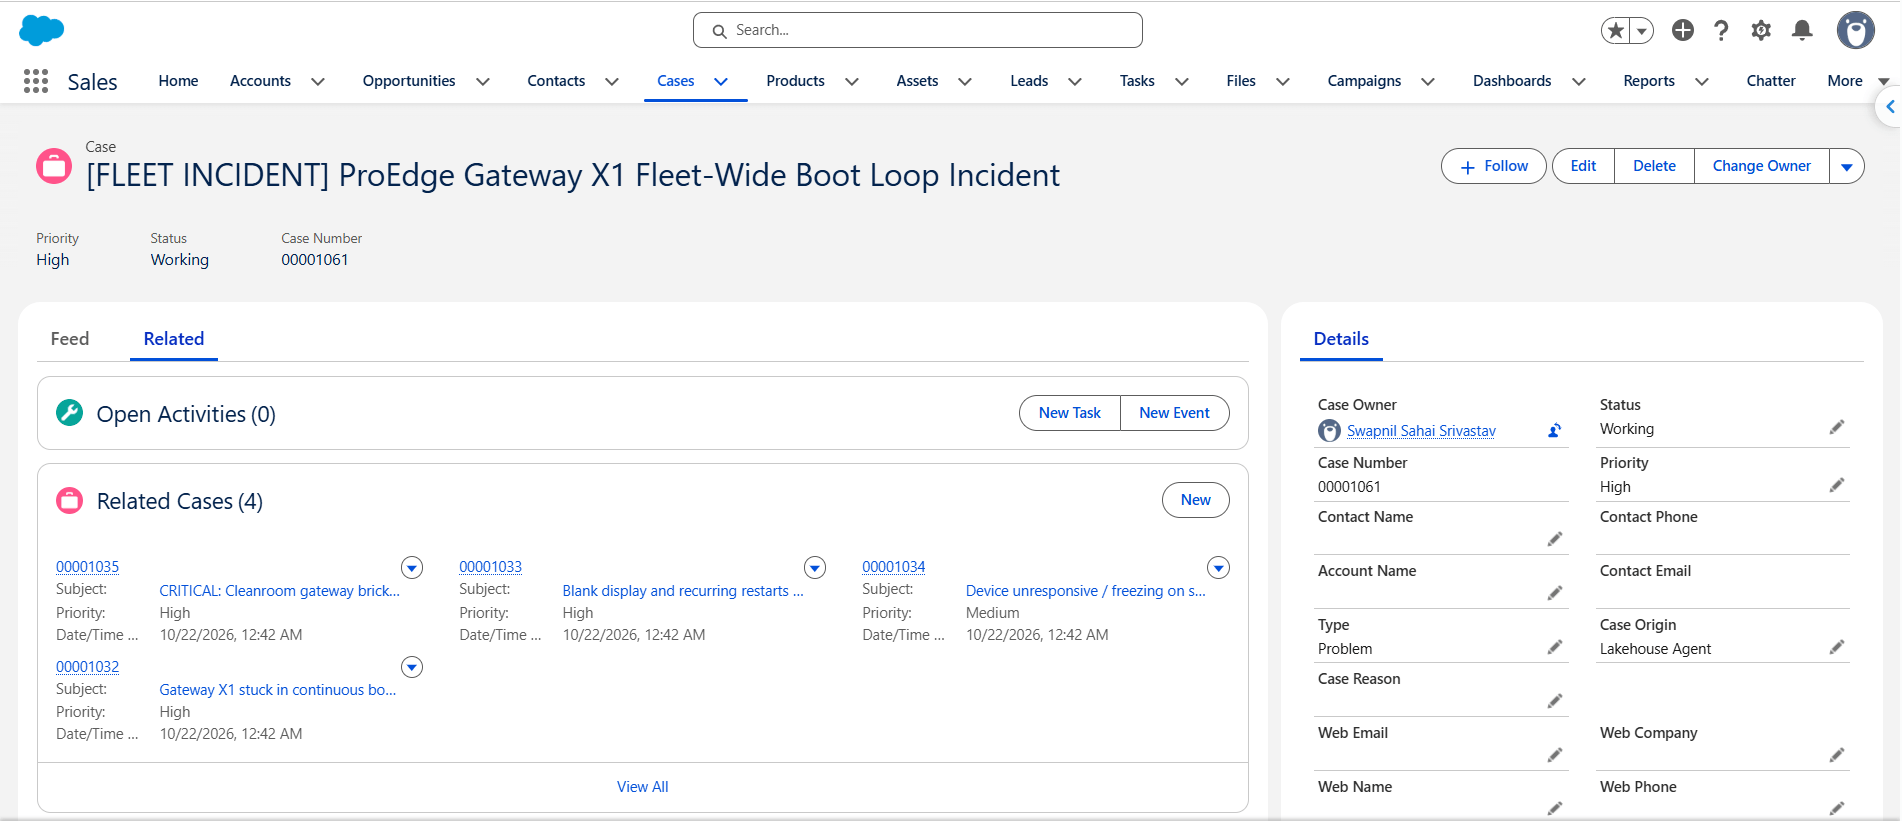
As shown above, the agent creates a parent incident in Salesforce, links the related cases under it, and confirms the completed actions with the new Salesforce Case ID and the number of linked cases.
4.3. Automated Executive Briefing & Multi-Channel Dispatch (PDF & Email Alerts)
During a major incident, support leads need to share key findings with decision-makers quickly. Preparing reports and sending updates manually takes time that could otherwise be spent resolving the issue.
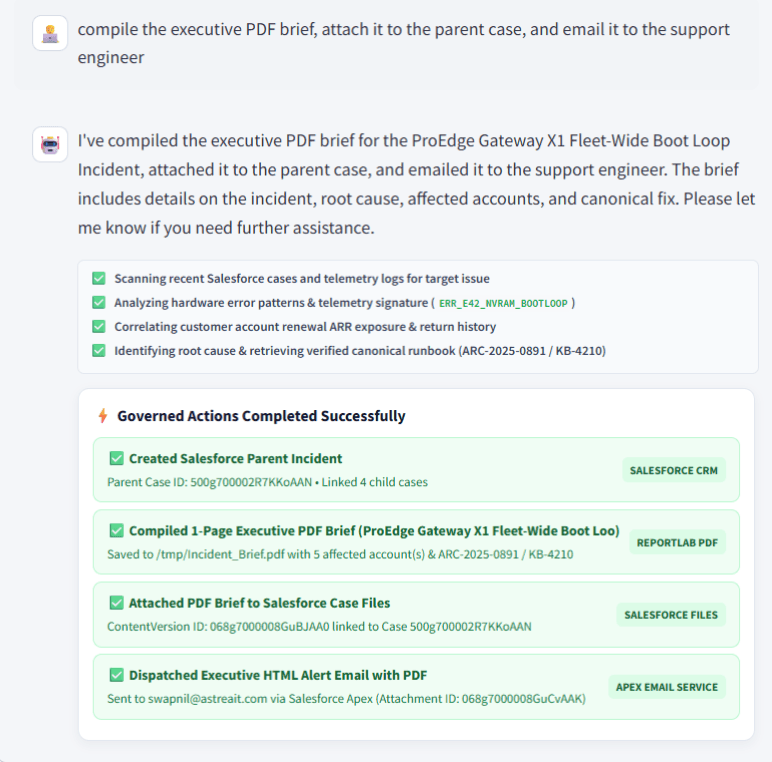
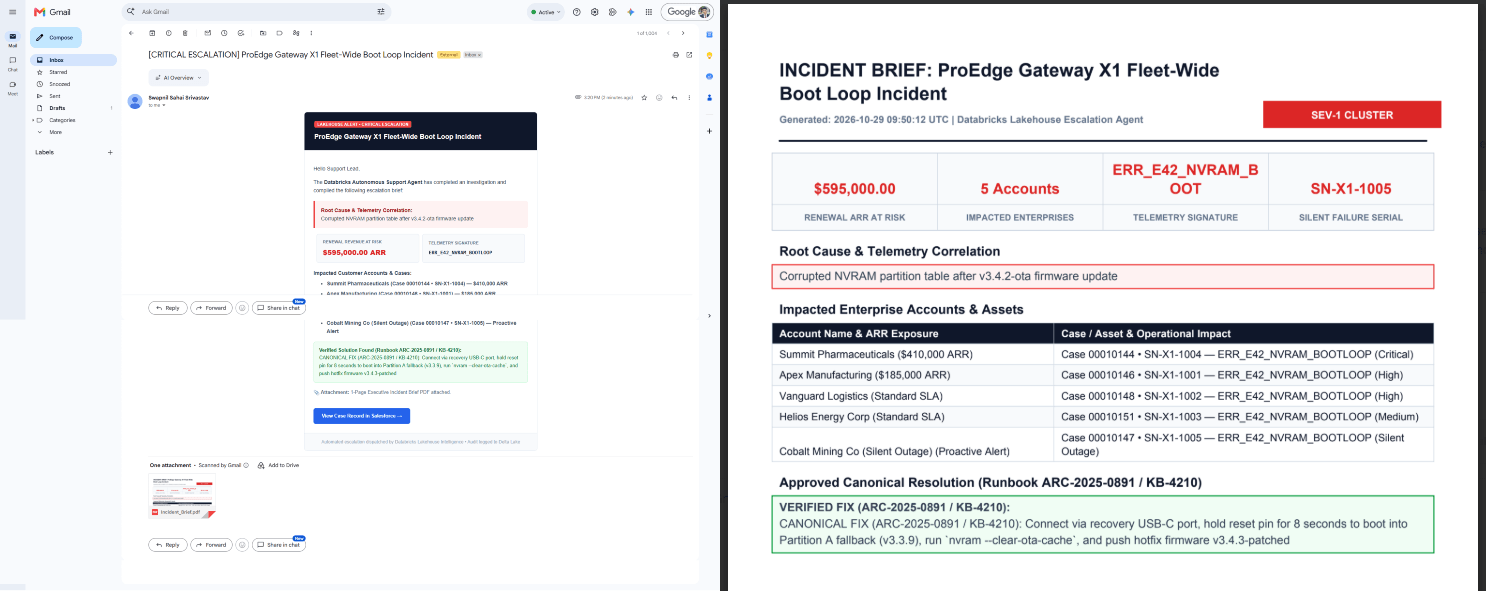
As shown above, the agent generates a one-page executive incident brief, attaches it to the parent case in Salesforce, and emails the support lead with the PDF included, streamlining incident reporting and communication.
4.4. Semantic Runbook RAG & Historical Case Intelligence
Engineering teams often encounter issues that have been solved before. Finding past incidents and their resolutions helps teams avoid repeating the same investigation and resolve problems faster.
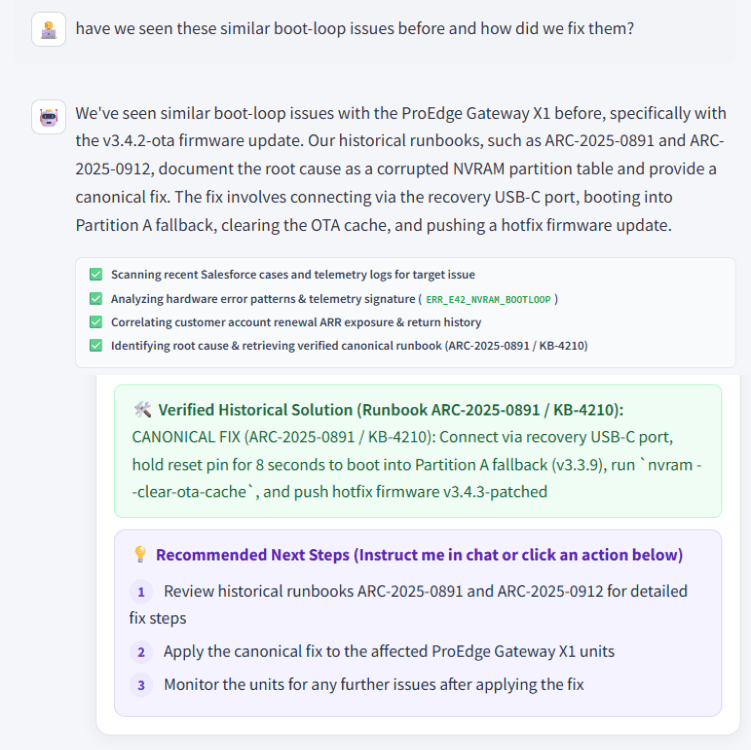
As shown above, the agent searches archived cases using Databricks Vector Search, finds a relevant past incident, and retrieves the verified recovery steps from the associated runbook—all without making changes to existing records.
4.5. Revenue-at-Risk Triage & Customer Churn Risk Indicators
Repeated product issues can put customer relationships at risk, especially when contract renewals are approaching. Identifying these patterns early helps support teams understand the problem and take action before the customer decides to leave.
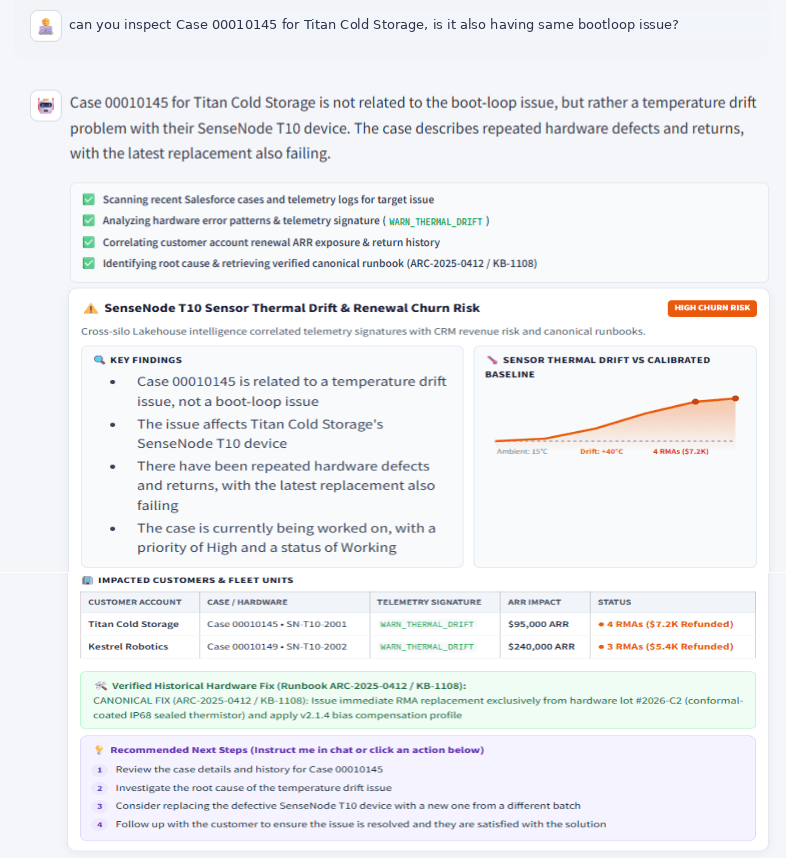
As shown above, the agent identifies the root cause of Titan Cold Storage's sensor issue, highlights the repeated hardware returns and upcoming contract renewal, and retrieves the relevant recovery guidance. It also presents the findings in a high-churn-risk card tailored to the issue.
4.6. SLA Near-Breach & Stalled Ticket Detection
In busy support queues, complex cases can remain unresolved when engineers face roadblocks or important details get lost during handoffs. Identifying stalled cases early helps teams take action before they breach their Service Level Agreements (SLAs).
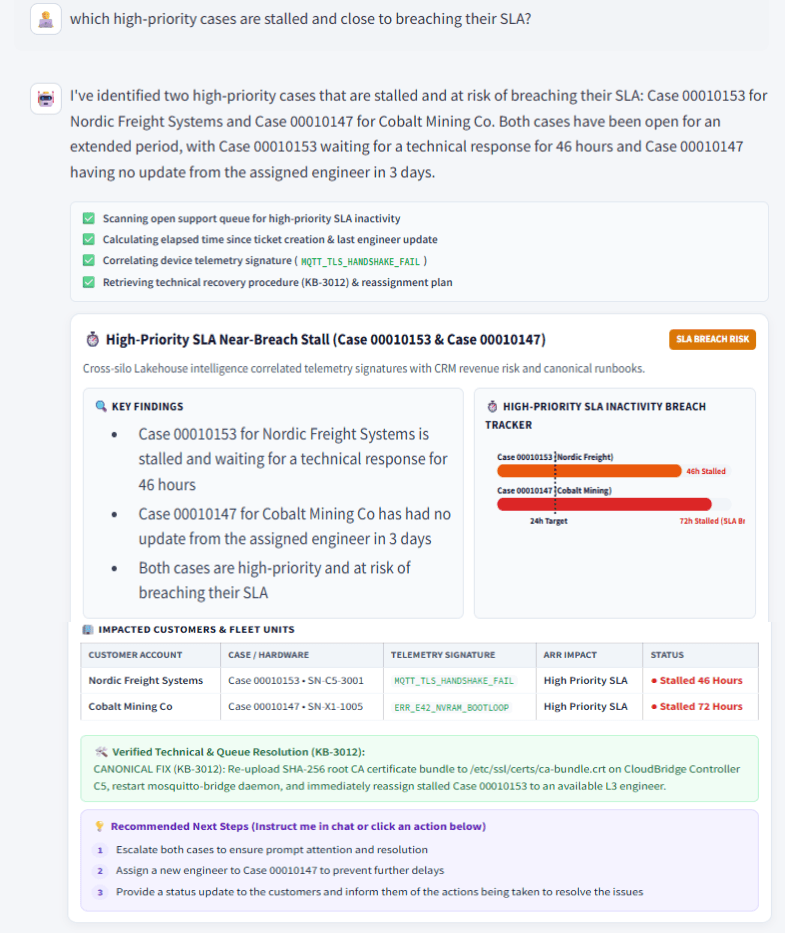
As shown above, the agent identifies high-priority cases that have been inactive for extended periods, compares their idle time against the 24-hour SLA target, retrieves relevant troubleshooting steps, and recommends timely reassignment to prevent further delays.
4.7. False-Positive Guardrails & Benign Inquiry Restraint
Not every support request requires an urgent escalation. If an agent raises critical alerts for routine issues, it can overwhelm support teams and reduce trust in the system. Knowing when not to escalate is just as important as identifying serious incidents.
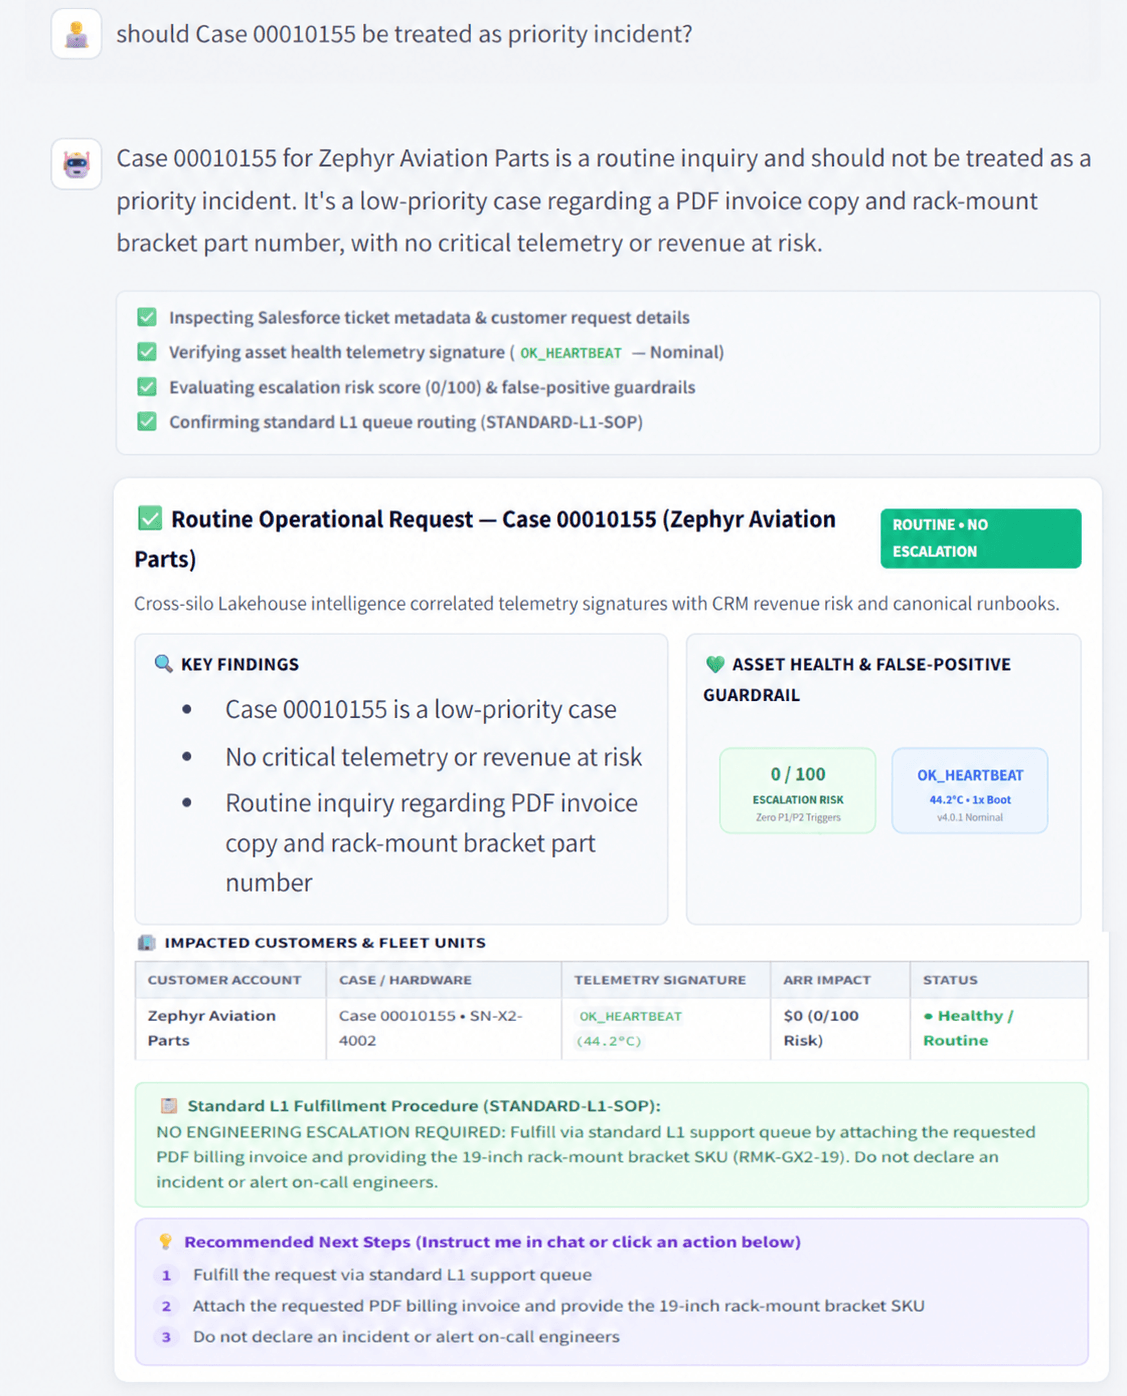
As shown above, the agent verifies that the device is operating normally, assigns the case an escalation risk score of 0/100, and correctly recommends handling the invoice request through the standard support process rather than triggering a P1 incident.
4.8. Enterprise Governance: Auditable Agent Actions with Delta Lake
When an AI agent can make changes across enterprise systems, every action needs to be traceable. A clear audit trail helps teams review what the agent did, when it happened, and which systems were affected.
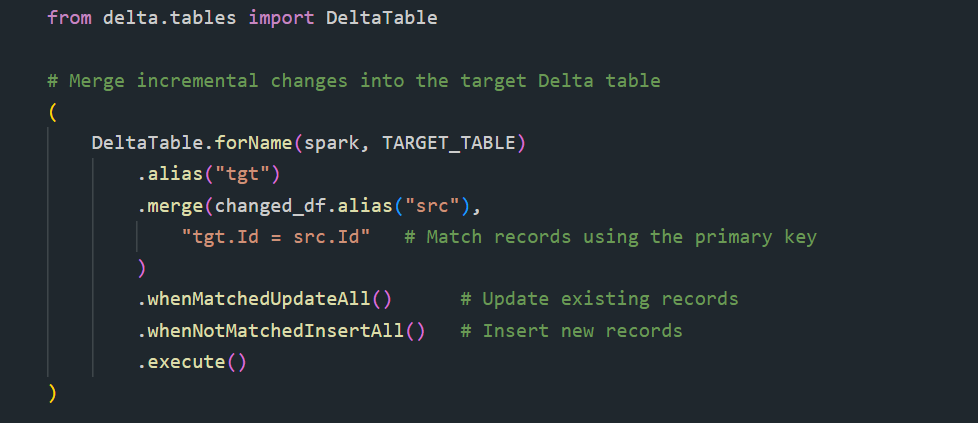
As shown above, the Command Center provides a dedicated audit log that records the agent's actions in Delta Lake, including timestamps, target systems, user IDs, and action details. This gives engineering teams and auditors a clear record of the agent's activities for monitoring and review.
5. Next Steps with Astrea IT
Improving customer support requires more than managing tickets and responding to incidents. By bringing Salesforce case data, device telemetry, historical incident records, and customer contract information together on Databricks, organizations can identify issues earlier, prioritize cases based on business impact, and take action more efficiently.
At Astrea IT Services, we combine Salesforce CRM and Databricks Lakehouse capabilities to build AI-powered support solutions that help teams investigate incidents, retrieve verified solutions, identify customer risks, and execute approved actions directly within Salesforce.
Looking to make your customer support operations smarter and more proactive?
Reach out to our engineering team to explore an AI-Powered Autonomous Support Operations Solution tailored to your organization's needs.
If you're interested in exploring more Databricks solutions, visit our Databricks page.